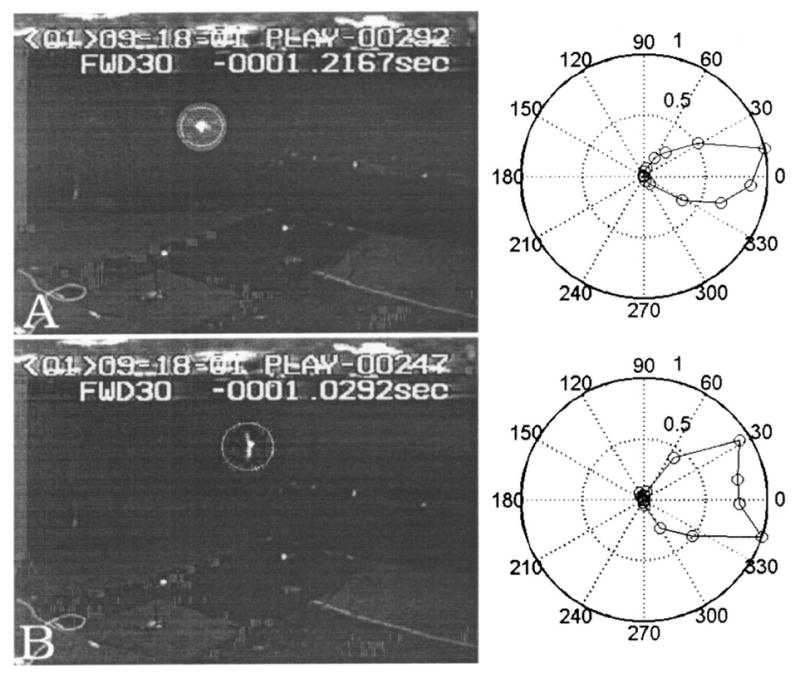
FIG. 11.

The images in the left column are taken from one of the video camera records of a trial. The location of the bat is circled. The images are roughly 190 ms apart in time. The right column shows the polar plot of intensity (maximum intensity normalized to 1.0, and represented by outermost ring of the polar plot) from the vocalizations made during the respective frames. The circles denote actual intensity data points. In A the bat is in level flight, heading parallel to the plane of the camera. Note that the beam pattern has a single large lobe. In B the bat is banking sharply as can be deduced from the relative positions of the wings. It is moving into the plane of the camera. Note that the beam pattern now has a prominent notch. Animations of this trial may be seen at http://www.bsos.umd.edu/psyc/batlab/jasa03/. The original grey levels of the camera images have been re-mapped in a nonlinear fashion to enhance the images.
