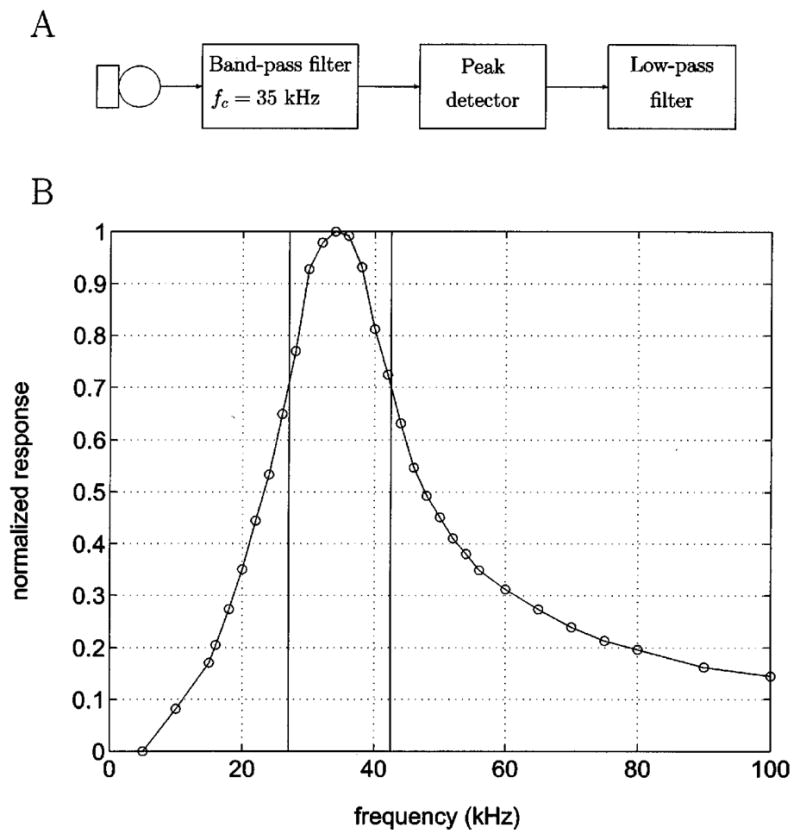
FIG. 3.

A. Schematic of signal processing hardware. B. Filter characteristics of the bandpass filter used. The x-axis shows the frequency, while the y axis shows the normalised response. The vertical bars correspond to the 3dB (half-power) points ie. the start and stop frequency. Examples of band-pass signal and envelope extraction may be seen in Fig. 4 A and B.
