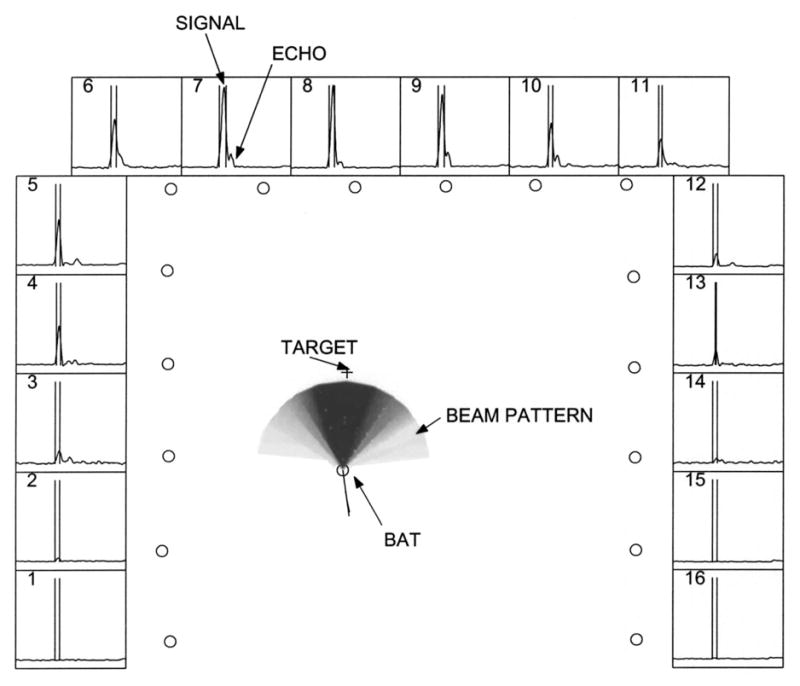
FIG. 5.

Beam pattern reconstruction. Central panel shows the reconstructed beam pattern. The 16 circles along the edges of the panel are the positions of the microphones in the array. The pattern is normalized such that the peak intensity has a value of 1.0 and is colored black. Lighter colors denote progressively lower intensities. The circle at the center of the beam pattern represents the position of the bat. The + symbol represents the position of the worm. The thin curved line terminating at the bat’s position is the trajectory of the bat up to that frame. The straight line drawn from the bat represents the direction of motion of the bat (in this frame the two overlap). Surrounding panels (numbered 1 through 16) show the envelope signals digitized from each microphone. All the side panels have the same scales. 20 ms of data are shown. The signal on each panel is time shifted to compensate for the time of travel of the sound from the bat to the corresponding microphone. As a result the direct signal from the bat (first sound) lines up on all the panels. A fairly loud echo (second smaller bump) doesn’t as its source is at a differnt position. This makes it easier to segment the signals and discard the echoes. The segmentation for the vocalisation shown is depicted as two vertical bars bracketing the relevant portion of the envelope trace.
