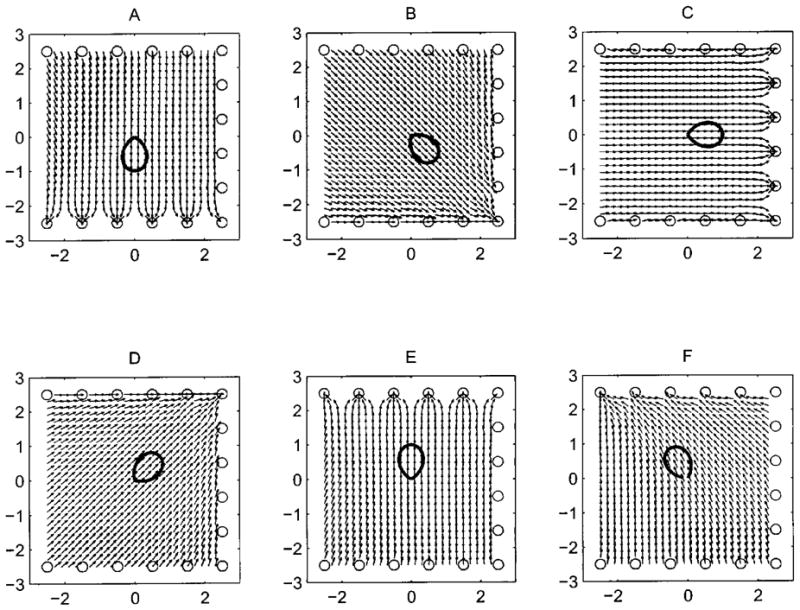
FIG. 6.

Plots of estimated head aim at different points within the space enclosed by the array (small black arrows) with a polar plot of the beam intensity profile (bold pattern) overlaid at the center. The direction the beam is pointing in corresponds to the peak of the profile. Plots A to E demonstrate that errors in computing headaim grow large only when the source is close to the edge of the array (around 1 m). F demonstrates that if the beam is directed out of the space enclosed by the array estimates become biased even near the center of the array. The x and y axes tick marks are in meters.
