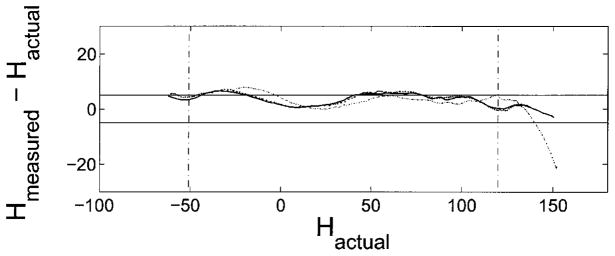
FIG. 7.
This graph sumarizes the calibration runs. The y-axis shows the angular difference between the emitter direction observed from the video (H⃗actual) and the beam center estimated from the array data (H⃗computed) plotted against H⃗actual. The two horizontal lines mark ±5°. This graph illustrates the edge effect predicted by the simulations (see Fig. 6). The edge effect is seen as an increase in bias of the error towards one direction as H⃗actual begins to approach the edge of the array. The average of these traces between the two vertical dotted lines at −50° and +120° was used to create a calibration curve to map the measured beam axis to a corrected beam axis. The final beam axis compututation results in an error of ± 1.4°.

