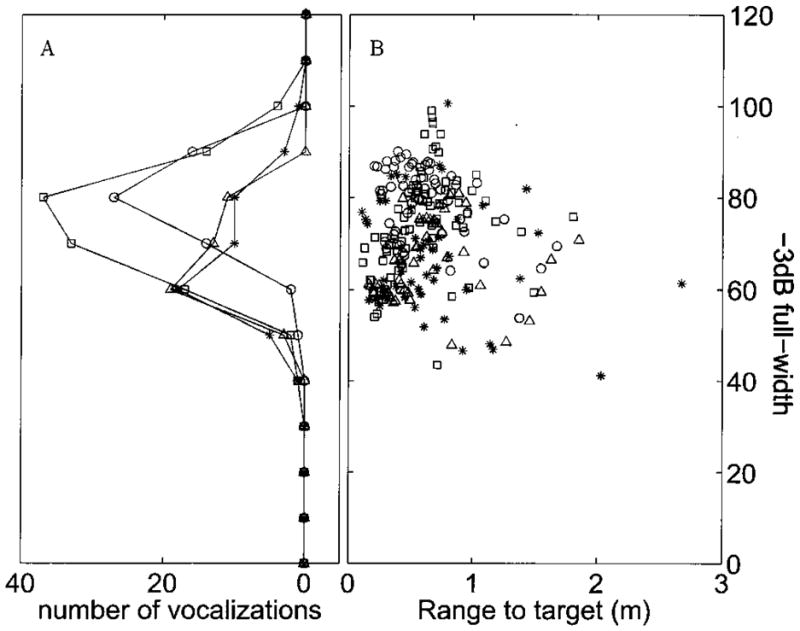
FIG. 9.

A shows a frequency histogram of the computed beam widths over 13 trials and 4 bats. B shows the data from which this histogram was made plotted against the range to target at which the measurements were taken. The data from different bats are shown as different symbols.
