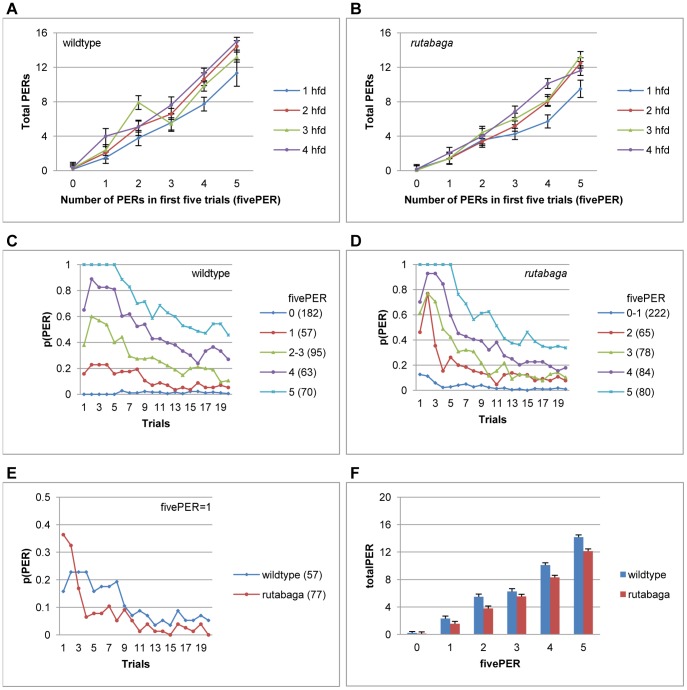
Figure 3. The number of PERs produced during the first five trials predicts the upcoming pattern of habituation.
A-B. TotalPER increases in proportion with fivePER for the wildtype flies (A) and rutabaga (B) between 1–4 hfd. C-D. Habituation curves for homogenous subsets of fivePER (Scheffe) for the wildtype flies (C) and rutabaga (D). E. PER habituation for the wildtype flies and rutabaga that emitted 1 PER during the first five trials (fivePER = 1). F. Summary graph showing totalPER for different fivePER scores. Data collapsed across 1–4 hfd in C-F. Numbers in parantheses indicate sample size.

