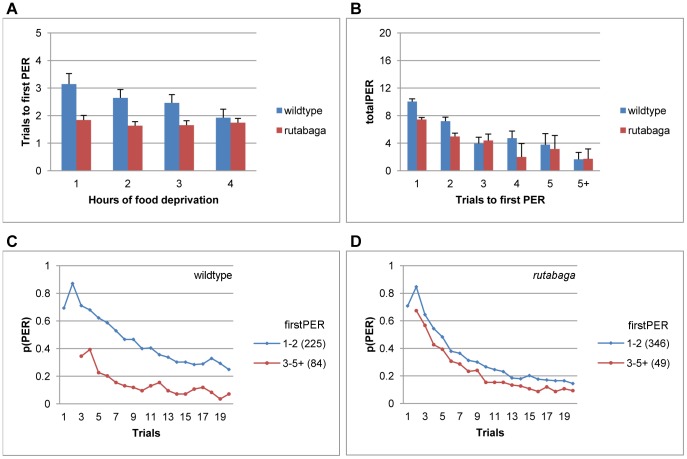
Figure 4. Trials to first PER predict the upcoming pattern of habituation.
A. Average firstPER following 1–4 hfd. B. Average totalPER scores for the wildtype flies and rutabaga that started responding on trials 1–5+. C-D. Habituation curves for homogenous subsets of firstPER (Scheffe). Habituation curves of rutabaga are plotted in accordance with the subsets identified for the wildtype flies for comparability. Data are collapsed across 1–4 hfd in B-D. Numbers in parantheses indicate sample size.

