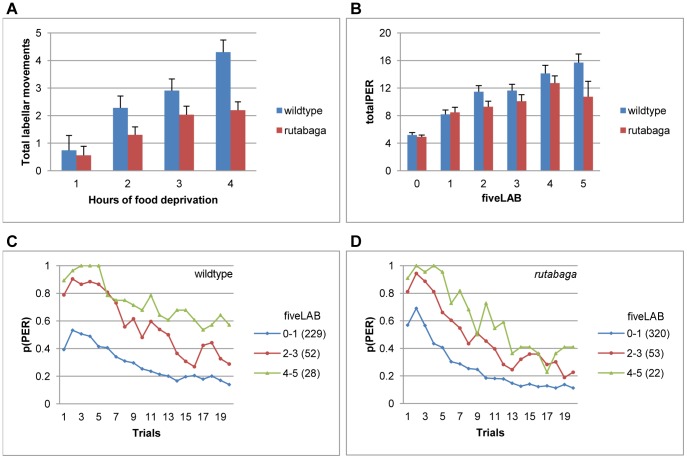
Figure 6. Number of labellar movements emitted during the first five trials (fiveLAB) predicts upcoming PER habituation.
A. Total number of labellar movements produced by the flies that emitted at least 1 PER between 1–4 hfd. B. TotalPER for the wildtype and rutabaga flies that produced 0–5 fiveLAB. C-D. Habituation curves for homogenous subsets of fiveLAB (Scheffe). Habituation curves of rutabaga are plotted in accordance with the subsets identified for the wildtype flies for comparability. Data are collapsed across 1–4 hfd in B-D. Numbers in parantheses indicate sample size.

