
Figure 6. Threshold condition for global invasion for shorter infectious periods: simulation results.
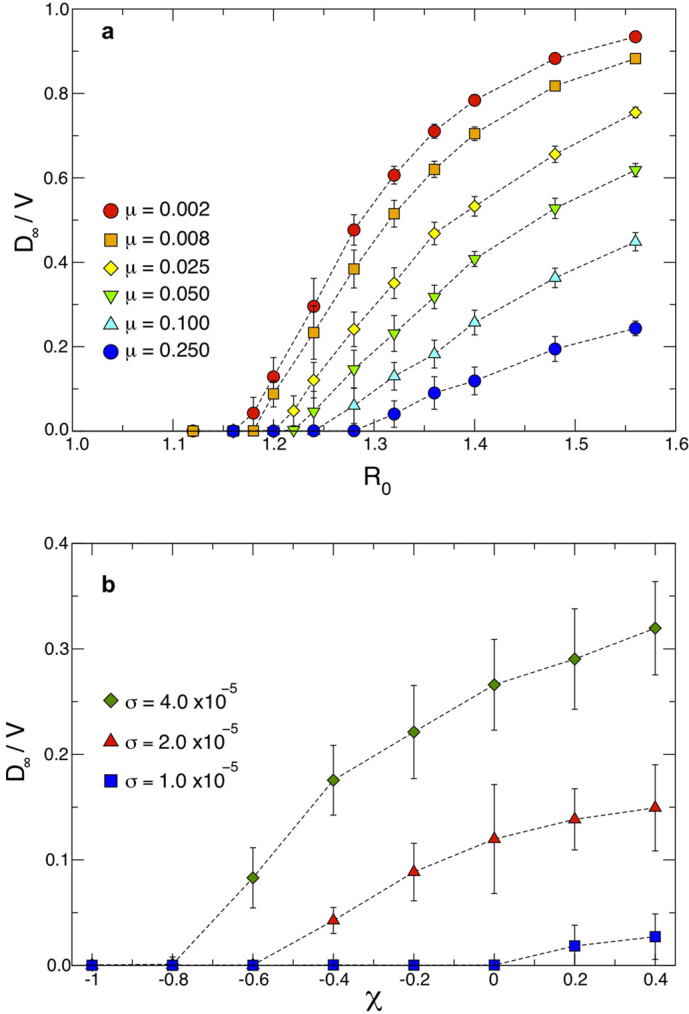
(a) Average final fraction of infected subpopulations D∞/V (symbols) and standard deviations (error bars) obtained from simulations as a function of the basic reproductive number R0, for different SIR-like disease characterized by different infectious periods. Here we consider a diffusion rate rescaling  and χ = −1. All other parameters are set as in Figure 4b. (b) Average final fraction of infected subpopulations D∞/V (symbols) and standard deviations (error bars) obtained from simulations as a function of the length of stay parameter χ, for different values of the diffusion rate rescaling σ. Here the same parameters of Figure 4a are used, except for a shorter infectious period, corresponding to μ = 0.05.