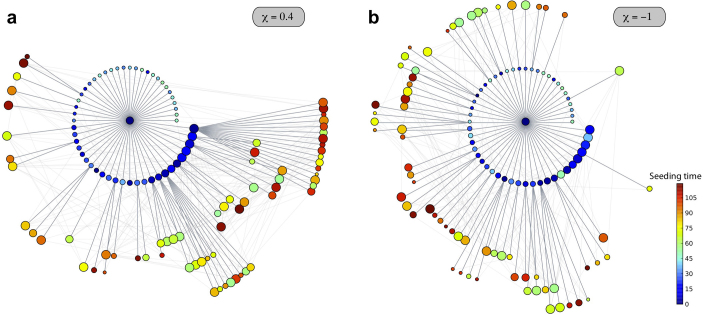
Figure 7. Epidemic invasion trees for shorter infectious periods.
The cases of a positively-correlated (χ = 0.4) and negatively-correlated (χ = −1) length of stay are shown. The synthetic network is characterized by a power-law distribution  with γ = 2.1, size V = 104 subpopulations and average population size
  . An SIR dynamics starting from the same seeding node (at the center of each visualization) is simulated, with R0 = 1.8, σ = 10−4,
  . All parameters are thus set equal to the ones in Figure 5, except for the shorter value of the infectious period considered, corresponding to μ = 0.05. As in Figure 5, only the first 120 nodes to be infected are displayed for the sake of visualization, on successive layers of invasion. Larger width grey links correspond to the paths of infection and lighter grey ones to the existing connections among visible nodes. Nodes are colour coded according to the time of their seeding, and their size scales with their degree; nodes in the first layer are ordered according to their degree to highlight the role of different degree nodes in the hierarchical invasion pattern in the two cases.

