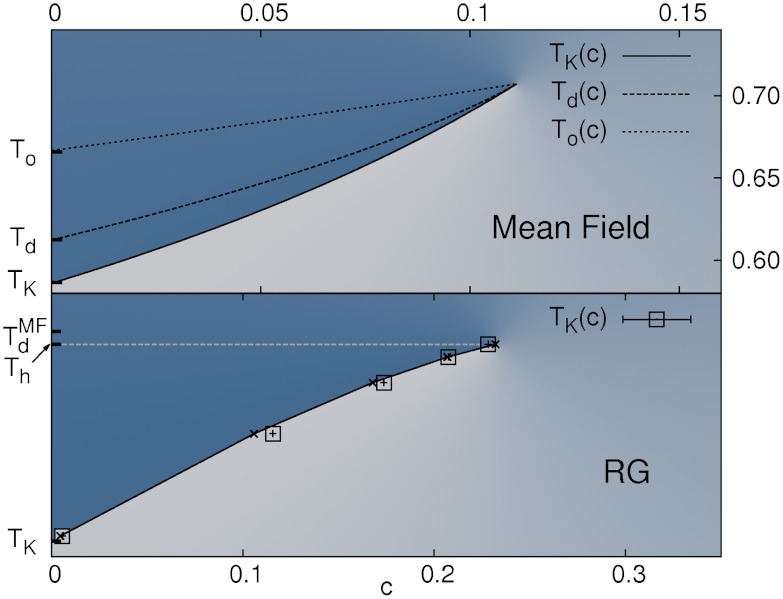
Fig. 1.
Top box: Phase diagram for the p = 3-spin disordered model 24. The continuous line corresponds to ideal glass transitions taking place at TK(c). The two dotted lines (from top to bottom) correspond respectively to the onset temperature To(c) and the mode coupling critical temperatures Td(c). Bottom Panel: Phase diagram obtained by the renormalization group approach for Td/TK ≃ 1.4 (corresponding schematically to OTP). The variable on the x-axis is proportional to the concentration of pinned particles. The squares are the results obtained by RG for the ideal glass transition line TK(c). The continuous line corresponds to the phenomenological result cK ∝ sc/Y. The endpoint of the transition line takes place at a temperature Th < Td in contrast to the mean field case.

