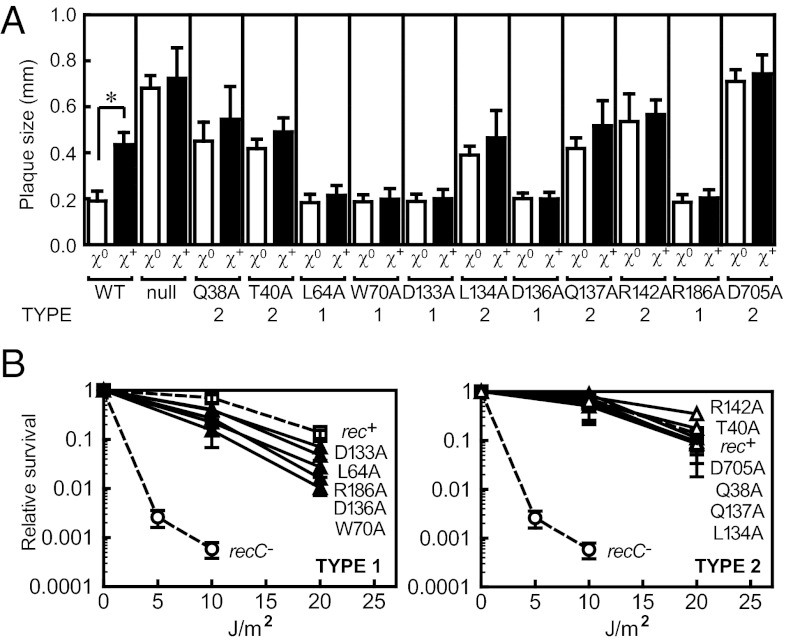
Fig. 2.
Phenotypic assays reveal defects in recognition of χ by the RecC-channel mutants. (A) The sizes of phage λ plaques distinguish χ recognition for the recC mutants. Each bar represents average with SD of 10 individual plaques; *P < 0.005 in t test. (B) UV resistance of recC mutants. (Left) Type 1 mutants, ▲; (Right) type 2 mutants, △; recC+, □; and recC− (without plasmid), ○. Averages with SD from at least two independent experiments.

