Fig. 1.
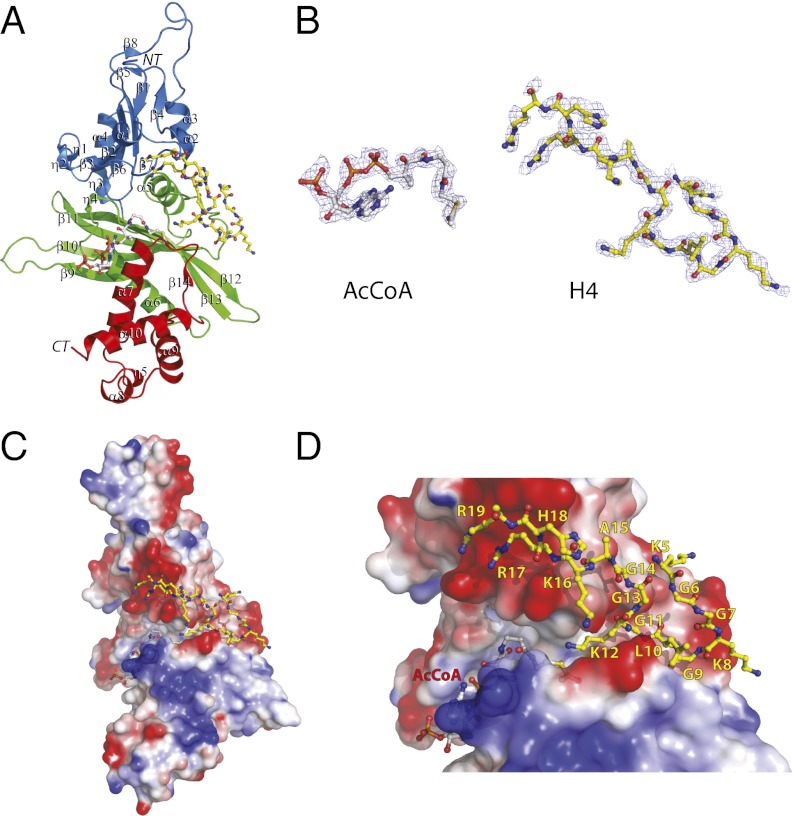
Crystal structure of human HAT1. (A) Overall fold of HAT1. The structure is shown in cartoon representation with the N, central, and C domains colored in blue, green, and red, respectively. H4 peptide and AcCoA are shown in stick-and-ball representation with carbon atoms in yellow (H4) and gray (AcCoA). (B) Electron density map of AcCoA and H4 peptide. The Fo-Fc maps were computed after simulated annealing with AcCoA and H4 peptide omitted from the atomic model and shown in mesh (contoured to 1.0 σ). AcCoA and H4 are presented in the same orientation as in A. (C) Electrostatic potential surface of the whole HAT1 molecule. Negatively and positively charged surfaces are colored in red and blue, respectively. (D) Close-up view of the substrate binding site of HAT1, with H4 and AcCoA shown in stick-and-ball representation. The figure was generated by using PyMOL (DeLano Scientific).

