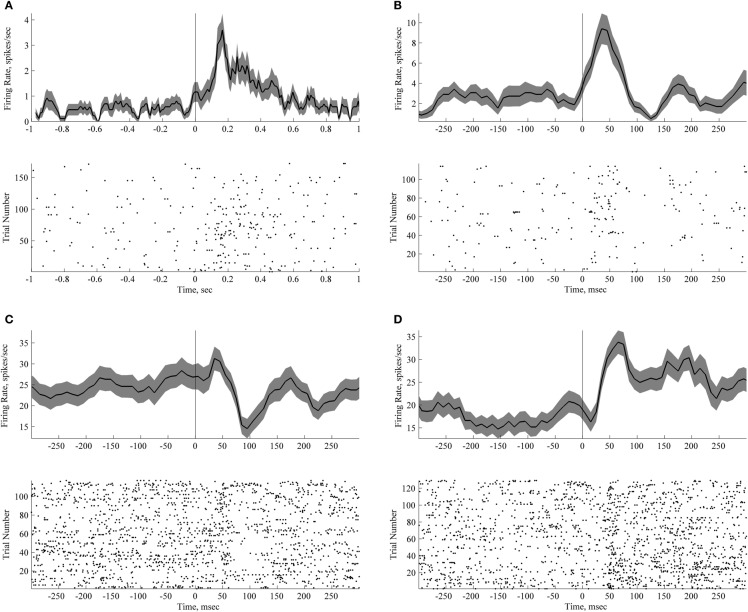
Figure 4.
Short lasting neuronal responses to passive sound presentation during quiet wakefulness and sleep. Each panel with a peri-stimulus histogram and a raster plot shows responses of an individual neuron. Zero time corresponds to the time of sound presentation. Trials with three different sounds are pooled together (vowel 1, vowel 2 and a novel noise-like sound). (A) Neuron responsive to sound presentation during passive listening. (B–D) Neurons responsive to sound presentation during sleep. Bin size for panels peri-stimulus histograms is 50 ms with 40 ms overlap.

