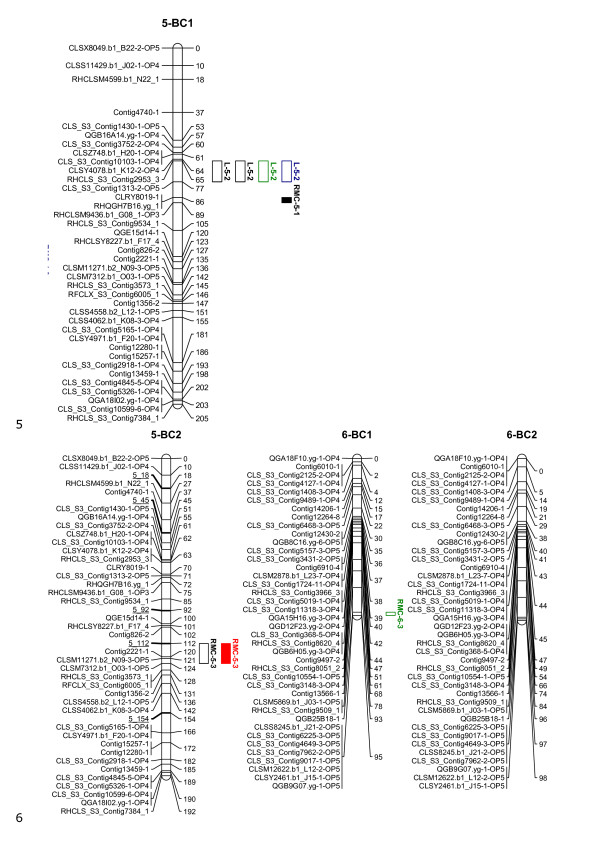
Figure 3.
Linkage maps of the BC1 and BC2 populations based on 100 and 458 individuals, respectively: Linkage groups 5-6. Markers are shown on the left of the bar and their positions on the right in cM. The added virtual markers on the BC2 map with missing scores are underlined. Vigour QTLs as mapped in BC1S1 and BC2S1 families under non-stress (black), drought (red), salt (blue) and nutrient deficiency (green) conditions are shown next to the marker positions. Open QTL block indicates a positive additive effect for the wild allele, and closed QTL block indicates a positive additive effect for the crop allele. Trait abbreviations: L: plant length, FW: fresh weight, DW: dry weight, RMC: relative moisture content.

