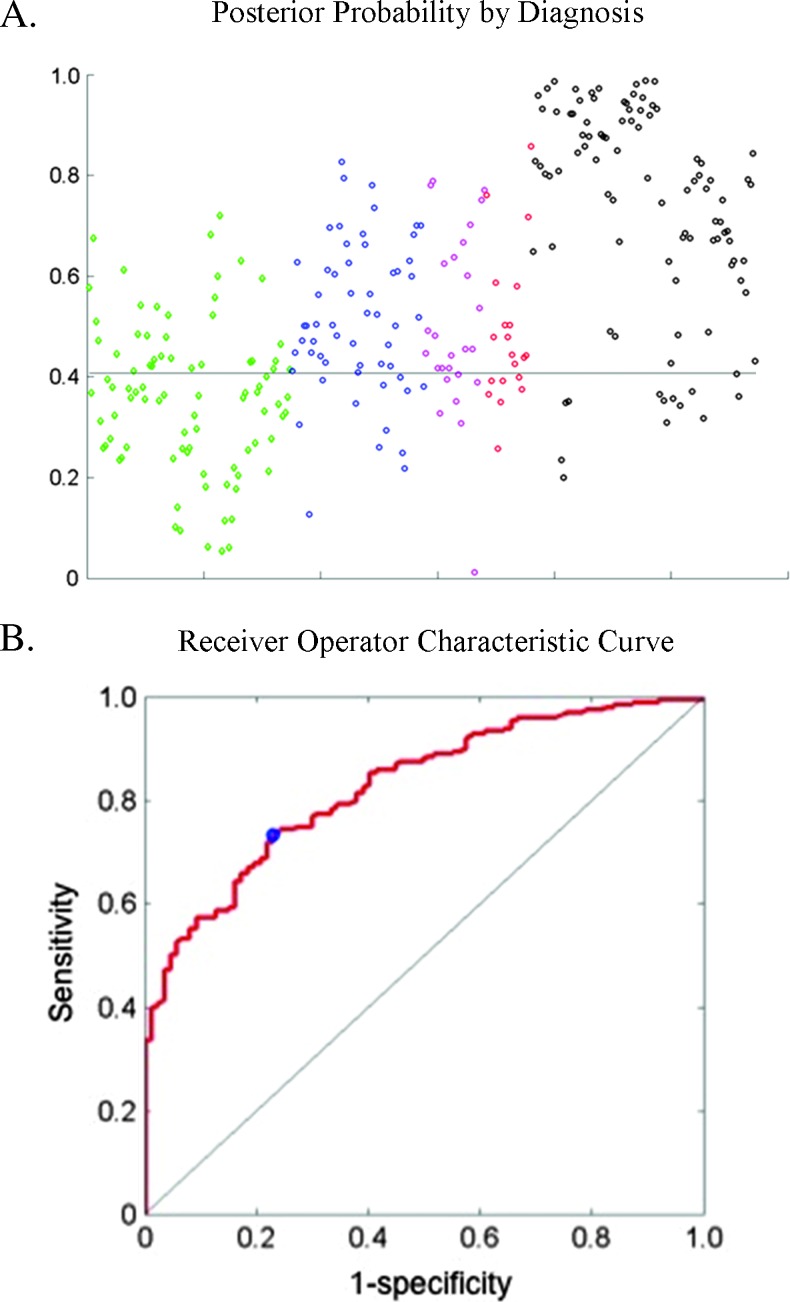
Figure 6.
(A) Scatterplot of posterior probability by diagnosis using the algorithm. The horizontal line indicates the optimum cutoff at 0.41. The color key is the same as in Figure 5. (B) Receiver operator characteristic curve using a three-feature classificat ion algorithm. The operating point at the optimum cutoff is shown with a blue circle and results in a sensitivity of 73%, a specificity of 77%, and an AUC of 0.83.

