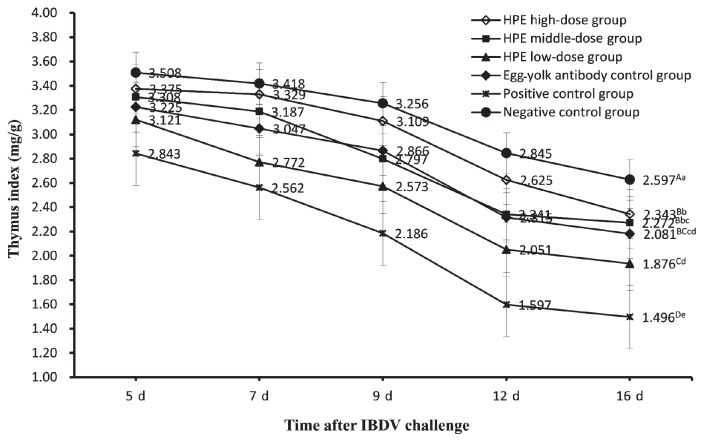
Figure 3.
The thymus index of chickens in all groups on days 5, 7, 9, 12, and 16 after IBDV challenge. Each point and vertical bar represents the mean and standard error (n = 10). Different capital letters indicated significant difference (P < 0.01) and different small letters indicated difference (P < 0.05) at day 16 after challenge, but the same letter indicated not.

