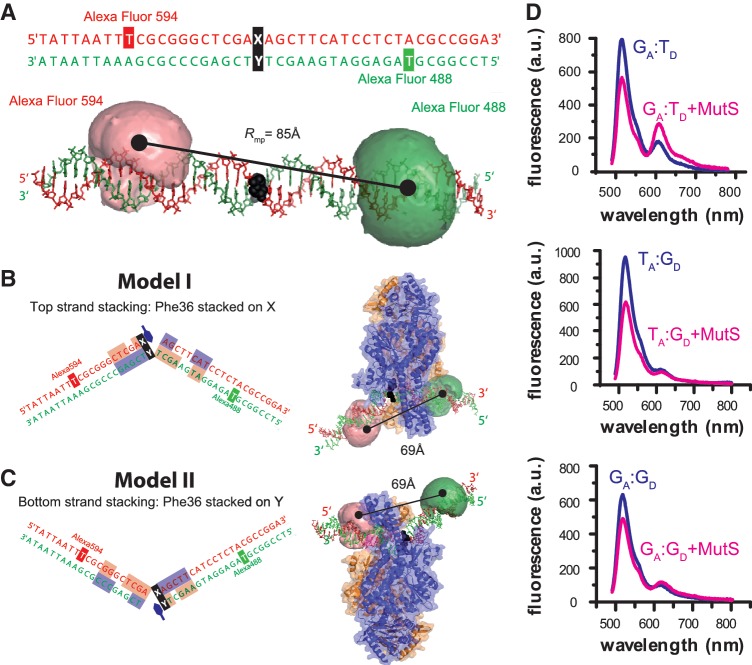
Figure 1.
MutS-binding orientation and DNA bending with mismatched DNA monitored by fluorescence spectroscopy. (A) Sequence and molecular model of the 42-bp DNA containing a central mismatch (XA:YD, black) and an Acceptor (Alexa Fluor 594, red) and Donor dye (Alexa Fluor 488, green) in the top or bottom strand. In the molecular model the dyes are depicted as clouds, representing possible positions of the freely rotating dye (21). The distance between the mean dye positions is Rmp = 85 Å. (B, C) Model of the complex between E. coli MutS and XA:YD DNA when Phe-36 (indicated with a blue hexagon) is stacked on the mismatched X base (B) or the mismatched Y base (C). Subunit A and B of MutS are shown in blue and orange and the DNA bases interacting which each monomer are shown in blue and orange, respectively. In both binding orientations (B or C), the distance between mean dye positions is Rmp = 69 Å; however, only in (B, Model I) the donor dye is in contact with the protein. (D) Steady-state fluorescence emission spectra of 10 nM GA:TD, TA:GD and GA:GD in the absence (blue curve) or presence (magenta curve) of 125 nM MutS dimer.

