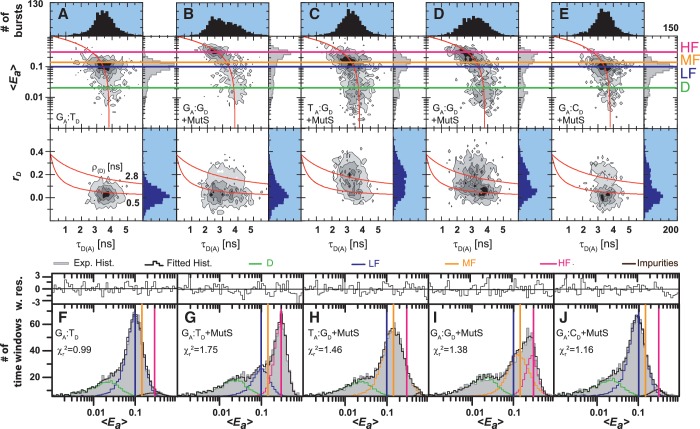
Figure 2.
smMFD analysis reveals directional MutS binding on mismatched DNA. Two-dimensional fluorescence parameter histograms counting single-molecule burstsfor smMFD measurements of free DNA (A) and MutS bound to different DNA substrates (B–E). In the MFD plots, the number of molecules (fluorescence bursts) in each bin is gray-scale coded from white (lowest) to black (highest) and it is normalized to a total of 1000 bursts. The MFD plots are linked by sharing the same x-axis: (Top panel) Apparent FRET efficiency 〈Ea〉 is plotted versus τD(A) (Donor lifetime in the presence of Acceptor) and (Bottom panel) donor anisotropy rD is plotted versus τD(A). 〈Ea〉 was obtained from raw signals (S) by correcting for green and red background fluorescence, spectral cross-talk (α = 0.057), detection efficiencies (gG/gR = 0.78) and the fluorescence quantum yields (ΦF(D) = 0.6 and ΦF(A) = 0.9) (see Supplementary Data Section 2.3) In the top panel, the red curve illustrates the static FRET line, Ea = 1–(τD(A)/τD(0)), where τD(0) = 3.8 ns is the fluorescence lifetime of donor in the absence of acceptor. The mean 〈Ea〉 of the different populations and donor only is shown by the magenta, HF, orange (Middle Fret, MF), blue (LF) and green (donor only, D) lines, respectively. In the bottom panel, the red lines illustrate the Perrin equation (rD = r0 /(1 + τD(A)/ρD)), using a value for fundamental anisotropy of r0 = 0.37 and a mean rotational correlation time, ρD, of either 0.5 ns or 2.8 ns, corresponding to the mean values of ρD for GA:TD–MutS (B) and TA:GD–MutS (C), respectively. The additional population observed at rD = 0.2 in the TA:GD but not the GA:TD data is indicative of differential donor–MutS interactions. (F–J): PDA of 〈Ea〉 of free DNA (F) and MutS bound to GA:TD (G), TA:GD (H), GA:GD (I) and GA:CD (J) with the data histogram in gray for 2 ms time windows. The data were fit to a three state model (Fitmodel 2, see Supplementary Data Section 2.3.1.) which accounts for D and either MF and HF (TA:GD–MutS, GA:G D–MutS) or LF and HF (GA:TD–MutS, GA:TD, and GA:CD–MutS). The PDA model functions of the fits were constituted by Gaussian distribution of inter-dye distances, with mean distance 〈RDA〉E, half-width HW and amplitude A (Supplementary Tables S1.1 and S1.7). The corresponding efficiency distributions were calculated by the retrieved model functions and equation E = 1/(1 + (RDA/R0)6. Reduced chi-square values ( ) and the residuals for each fit are indicated in the respective panel (see Supplementary Data Section 2 for Supporting Theory for FRET Analysis). A correction for the exact treatment of direct excitation was performed according to equation 18.33 in Sisamakis et al by additional accounting for a probability of direct acceptor excitation of pDE = 3.5% (22), so that most accurate distances should be obtained. Populations present in GA:TD and TA:GD data merge with those in the GA:GD data, consistent with MutS binding this symmetric mismatch in both orientations.

