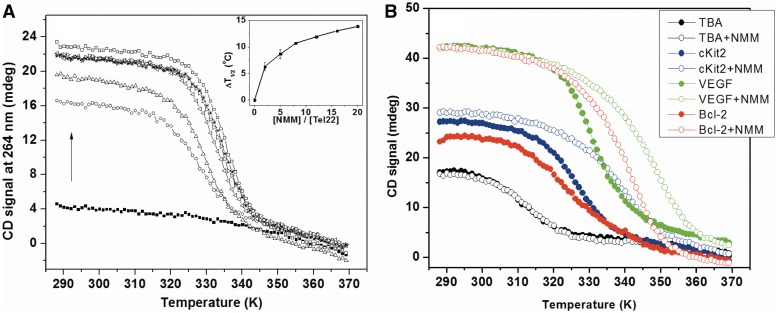
Figure 7.
(A) CD melting of 3.4 µM Tel22 annealed in 5K buffer alone or in the presence of 2, 5, 8, 12, 16 or 20 equivalents of NMM. All samples were equilibrated for >12 h at 30°C. Melting was monitored at 264 nm. Dependence of stabilization temperatures (ΔT1/2) on NMM concentration is shown in inset. (B) Representative CD melting curves for non-telomeric G-rich sequences (∼4.0 µM) in 5K buffer. Melting of GQs alone is show as solid circles. Melting of GQs in the presence of 2 equivalents of NMM is shown as open circles. The CD signal was monitored at 295 nm for TBA and at 264 nm for all other sequences.

