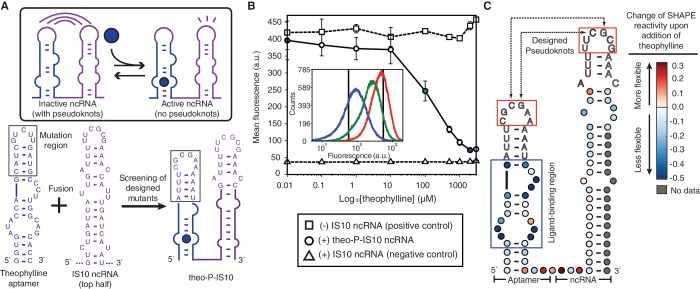
Figure 2.
Designed theophylline aptamer–IS10 ncRNA fusions. (A) The theophylline aptamer sequences (blue) were fused to the 5′ end of IS10 ncRNA (purple), and screening of seven designed pseudoknot mutants (Supplementary Figure S2) resulted in one functional fusion, theo–P–IS10 (P for pseudoknot). The proposed mechanism for allosteric switching of the fusion molecule is shown in the box. (B) Fluorescence assay of theo–P–IS10 using flow cytometry. The induction curves were plotted from the average values of three biological replicates at each theophylline concentration. The inset shows the cytometry histograms of three ligand concentrations (red—0.01 µM, green—100 µM, blue—2 mM), with the two black vertical lines showing the mean values of the positive and negative controls. The repression percentage between 2 mM and 0.01 µM theophylline is 83.0%, compared to 91.0% between the positive and negative controls. (C) SHAPE data of theo–P–IS10. The difference in nucleotide reactivity with and without the ligand is overlaid on a hypothesized secondary structure model of theo–P–IS10 based on Refs (21) and (24). Colors represent the changes of SHAPE reactivity upon addition of the ligand, with red colors showing positive changes (more flexible) and blues colors showing negative changes (more stable). The blue box is the known ligand-binding pocket. The red boxes are designed pseudoknot interactions. Original SHAPE data is available in Supplementary Figure S3A.

