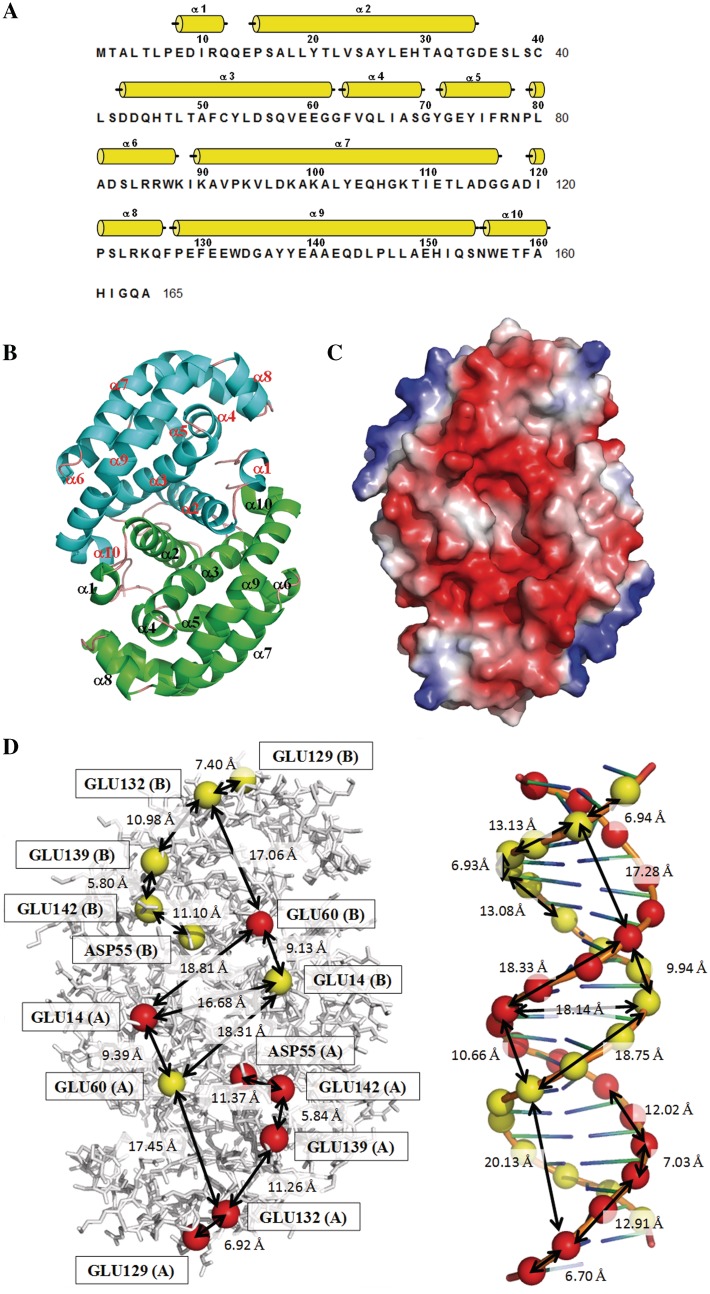
Figure 1.
The negative charge distribution of DMP19 resembles the B-form DNA helix. (A) The secondary structural elements are shown above the amino acid sequence, with yellow cylinders representing α-helices. (B) A ribbon diagram of the DMP19 dimer. The two monomers are colored green and cyan, respectively. (C) The molecular surfaces of the DMP19 dimer. Color-coding is by Pymol, with red to blue representing the electrostatic potential from −90 kBT to +90 kBT. A DNA-like negative charge distribution can be seen on one-dimensional surface of DMP19. (D) Comparison of the negative charge distribution of DMP19 and dsDNA. The spheres denote the DMP19 acidic residues that correspond to the negatively charged phosphate groups on the dsDNA. The approximate distances between spots are also shown.

