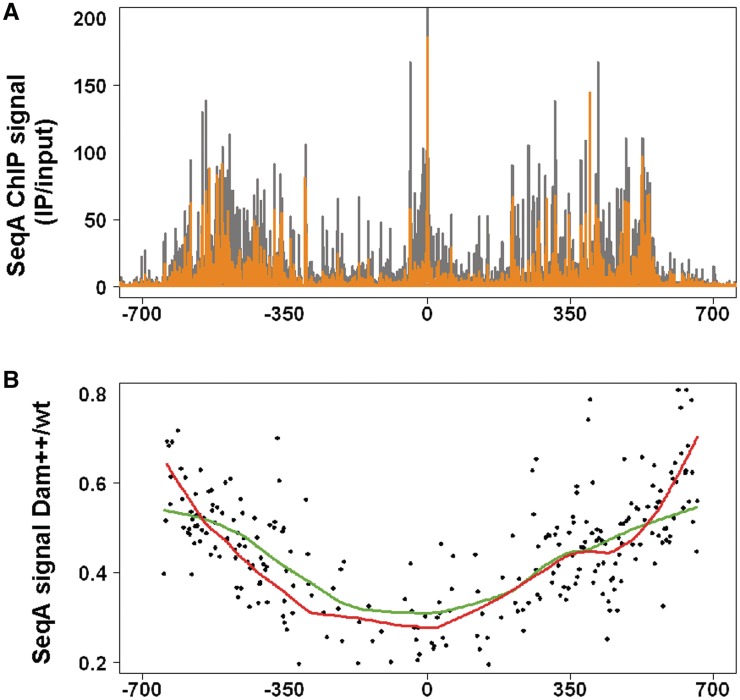
Figure 4.
SeqA and Dam compete for GATC sites. (A) ChIP-Chip binding profile of SeqA binding in cells overproducing Dam methylase (orange) compared to cells with wt level of Dam (grey). Temperature shift was as above with cells grown in LB medium (+/− 0.2 % L-arabinose) and cross-linking 15 min after synchronization. Dam induction was through the pBAD18 derivative pMQ430 (25). (B) The average SeqA ChIP signal for 249 SeqA binding blocks was calculated (see ‘Material and Methods’ section for details). Ratios of SeqA signals in Dam overproducing to wt cells were plotted versus chromosomal position. Lowess trendlines (f = 0.3) are given for high (green) and low (red) GATC density regions.

