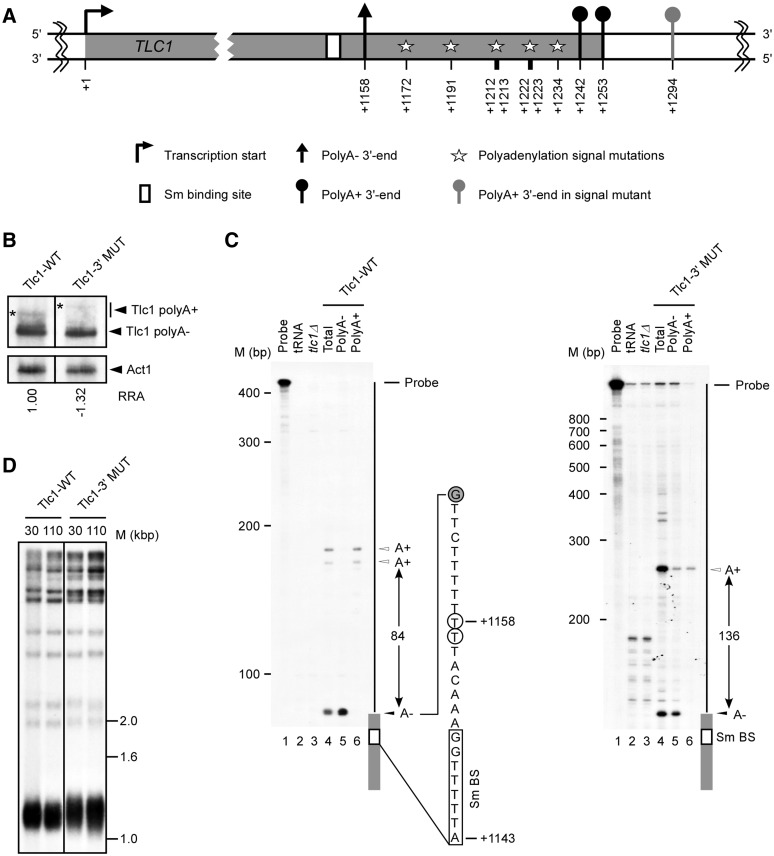
Figure 1.
Disruption of the polyadenylation signals does not affect the synthesis of mature telomerase RNA. (A) Schematic representation of the TLC1 transcription unit with a focus on the 3′-end. Stars represent mutations in all probable/cryptic polyadenylation signals near the TLC1 3′-end (A1172:C, A1191:G, A1212:G, T1213:C, A1222:C, T1223:C, A1234:G). The numbers are relative to TLC1 transcription start site (+1). (B) Northern blot analysis of Tlc1 RNA isolated from cells harboring wild-type TLC1 (Tlc1-WT) and TLC1 carrying mutations near the 3′-end (Tlc1-3′MUT). Stars (*) represent polyadenylated Tlc1 species. The relative RNA amount is an average of three experiments with a standard deviation of ±0.30 or less and was determined using an Instant Imager. (C) Mapping of the Tlc1 3′-ends was achieved by T1 RNase protection assays. RNAs were hybridized to antisense RNA probes specific for Tlc1-WT or Tlc1-3′MUT, and digested by ribonuclease T1. The labeled undigested RNA probe (probe) and the probe digested in the presence of tRNA (tRNA) were included as controls. The results of digesting the different probes after hybridization to RNA extracted from cells carrying a complete deletion of the TLC1 gene (tlc1Δ) was also included to ascertain the specificity of the different protected bands. PolyA− and polyA+ indicate the digestion of probes hybridized to RNA found in the flow-through and eluted fractions of oligo (dT) column, respectively. The position of the probe, the different protected 3′-ends and the distance separating these ends are indicated on the right of each panel. Nucleotide positions (+1143 and +1158) are according to transcription start site. Size markers are indicated on the left of each panel. The precise position of the 3′-end was mapped using a sequence ladder run in parallel lanes (data not shown). The sequence shown represents the sequence adjacent the Tlc1 3′-end (gray boxes). The empty box indicates the Sm binding site (Sm BS). The open circles indicate the previously mapped 3′-ends and the closed circles indicate the position of the observed G specific T1 cleavage. (D) Southern blot analysis of telomere lengths in strains harboring constructs with wild-type (Tlc1-WT) or polyadenylation signals mutant TLC1 (Tlc1 3′MUT). Genomic DNA was extracted from individual yeast clones grown for 30 or 110 generations, digested with XhoI and separated on an agarose gel. The different fragments were visualized using a randomly labeled probe complementary to the telomere sequence.

