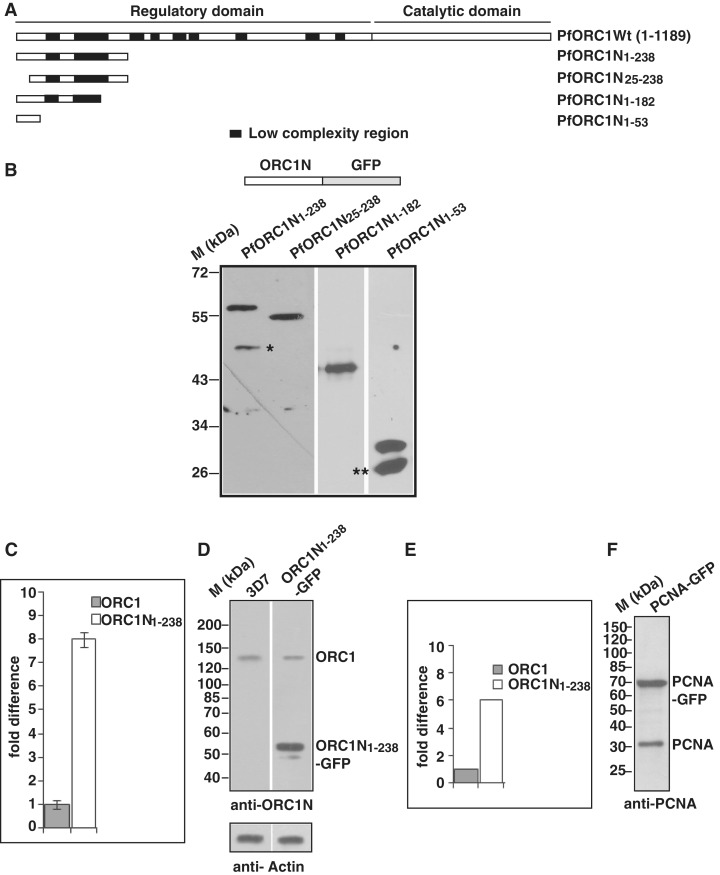
Figure 1.
Expression of the N-terminus of PfORC1 as GFP-fusion protein. (A) Schematic diagram of full length PfORC1. The putative regulatory domain (1–783 residues) and the catalytic domain (784–1189) containing the ATP binding and hydrolysis domain are shown. The black blocks indicate the low complexity regions with asparagine and lysine repeat rich regions. (B) The upper panel shows the schematic diagram of different forms of PfORC1N as GFP-fusion protein. The bottom panel shows the western-blot analysis of parasite lysate obtained from different parasite lines as indicated above using anti-GFP antibodies. Asterisk and double asterisk indicate likely degradation products. (C) Comparison of expression pattern of endogenous ORC1 and ORC1N1–238–GFP transgene in ORC1N1–238–GFP expressing parasites at the transcript level by real time PCR analysis. gapdh was used as control. ORC1N1–238–GFP shows several fold higher expression than endogenous ORC1 (D) Comparison of expression of endogenous PfORC1 and PfORC1N1–238–GFP at the protein level. Equal amount of lysate (∼100 µg) obtained from 3D7 wild-type or PfORC1N1–238–GFP expressing trophozoite stage parasites were resolved in SDS–PAGE followed by western-blot analysis by polyclonal antibodies against N-terminus of PfORC1. Top panel shows the expression of the respective proteins under the same experimental conditions. The control western blot using PfActin antibodies shows equal loading of proteins in each lane (bottom panel). (E) The intensity of the bands corresponding to endogenous ORC1 and PfORC1N1–238-GFP were quantified densitometrically and plotted accordingly. (F) Approximately 100 µg lysate obtained from PfPCNA-GFP expressing parasites were resolved in SDS–PAGE followed by western-blot analysis using polyclonal antibodies against PfPCNA. The results indicate that PCNA1-GFP is over-expressed compared to endogenous PCNA.

