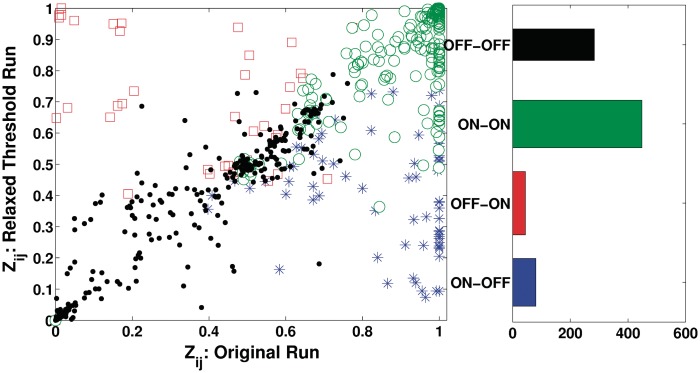
Figure 5.
Robustness analysis. The posterior probabilities P(zij = 1) for all common motifs j and genes i are plotted for the two enrichment thresholds, 9% (Original) and 10%. All common motifs/genes between the two cases are plotted. Four subcategories are shown: blue asterisks for links which are ON (Significant) in First run and OFF (Not significant) in second, red squares show links which are OFF in first run and ON in second, green circles represent those links which are ON in both experiments while black point markers correspond to the links which are switched off in both cases. The right panel shows the number of links in each of the four categories of links in this comparison.

