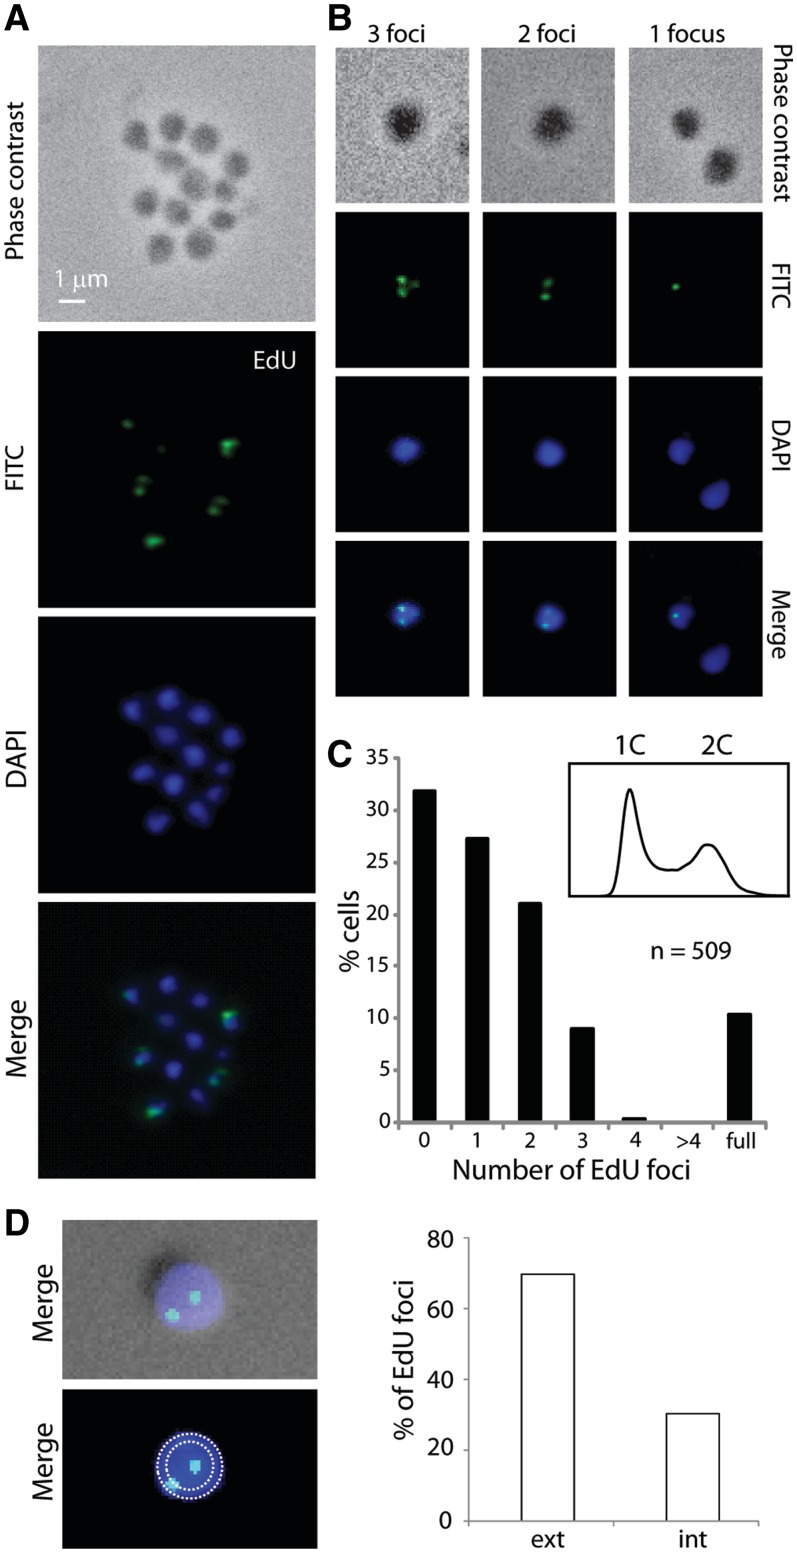
Figure 4.
Localization of replicating DNA in synchronized S. acidocaldarius cells. SacTK cells were synchronized using the baby machine method and then incubated at 75°C for 20 min with 200 µM EdU to label newly synthesized DNA. Images show phase contrast, DAPI staining of DNA (blue), EdU-AlexaFluor488 (green) and merged images. (A) A representative image of cells and (B) representative images of cells scored as showing 1, 2 or 3 EdU foci are shown. (C) The number of EdU foci detected was counted (509 cells total) and the percentage of cells in each category is shown. Cell synchronization was assessed using flow cytometry, shown inset. (D) Using 2D slices, template circles encompassing 100 and 50% of the cell area were generated and EdU foci were assigned to the inner or outer 50% of the cell area (n = 145).

