Figure 3.
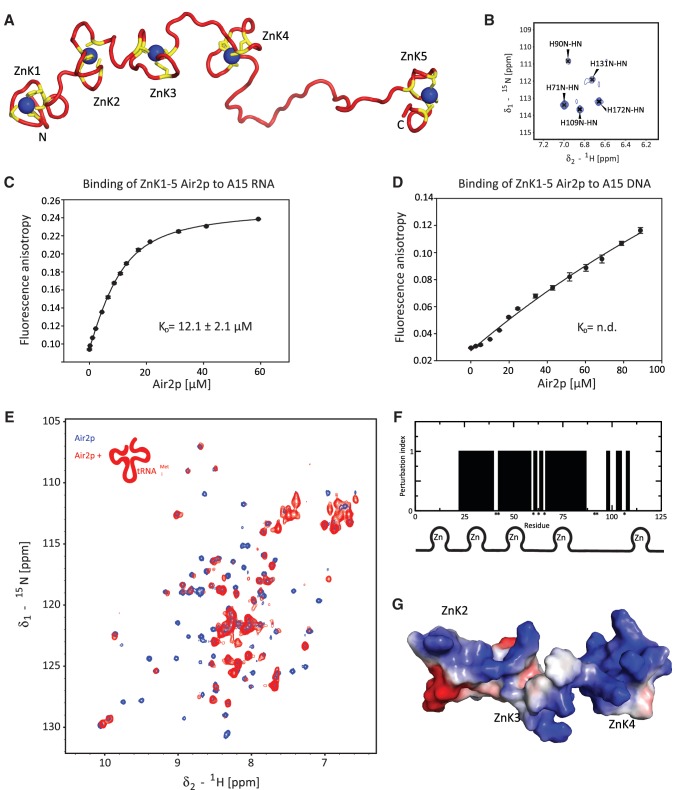
Structure and RNA-binding of ZnK1-5 Air2p. (A) The lowest energy structure of the Air2p ZnK1-5. The protein is shown as a ribbon model (in red) with the zinc-coordinating residues (CCHC) shown in yellow. The zinc ions are shown in blue. (B) Close-up view of the 1H-15N TROSY spectrum, showing the N-H correlations of histidines that are involved in the coordination of zinc ions. (C) Air2p ZnK1-5 binds A15 RNA. Binding isotherms for equilibrium binding of ZnK1-5 Air2p to fluorescently labeled A15 RNA, monitored by fluorescence anisotropy. (D) Air2p ZnK1-5 binding to dA15 DNA. The ionic strength and pH of the binding buffer was the same for both measurements. The dissociation constant (Kd) was calculated from the best fit of data using a single-site binding isotherm. (E) 1H-15N TROSY spectra of Air2p ZnK1-5 alone (in blue) and in the presence of one equivalent of hypomodified tRNAiMet (in red; 1H-15N HSQC) at 20°C. (F) Summary of chemical shift perturbations and line broadening of Air2p ZnK1-5 upon binding to hypomodified tRNAiMet. Affected residues (qualitatively described by perturbation index; yes=1, no=0) are plotted against the amino-acid residue number. The assignments of residues indicated by asterisks could not be obtained. (G) Solvent-accessible surface representation of the RNA-binding ZnK of Air2p (ZnK2, ZnK3 and ZnK4) colored by electrostatic potential (blue, positive; red, negative) of the representative structure.

