Figure 3.
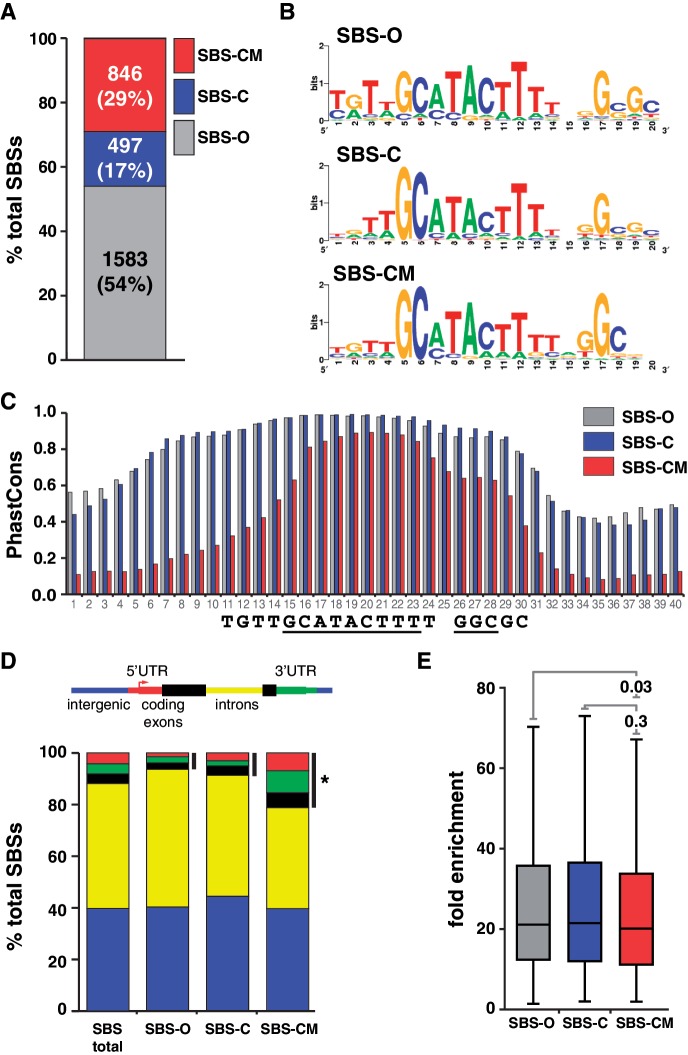
Distinct classes of SBSs are found in the genome. (A) Shown is a bar plot of the proportion of SBS-O, SBS-C and SBS-CM sites in the genome. Number and percentage of sites are indicated. (B) Shown are the sequence logos of Su(Hw)-binding motifs derived from SBS-O, SBS-C and SBS-CM sites. (C) Shown are the median PhastCons scores of the 40 nt encompassing the Su(Hw) consensus binding motif of SBS-O, SBS-C and SBS-CM sites. Numbers on x-axis indicate nucleotide position; sequence logo below is aligned to the plot. (D) Shown are the genomic distributions associated with total and SBS subclasses. Black bars indicate binding sites mapped to the 5′-, 3-UTRs and coding exons. *P = 2.002e-12 by two-proportion z-test. (E) Shown are the box plots corresponding to the fold enrichment values of the three subclasses of SBSs. Within each box, the black line indicates the median enrichment, boxes and whiskers represent 25–75 percentile interval and non-outlier range. P-values of Student’s t-test are indicated.

