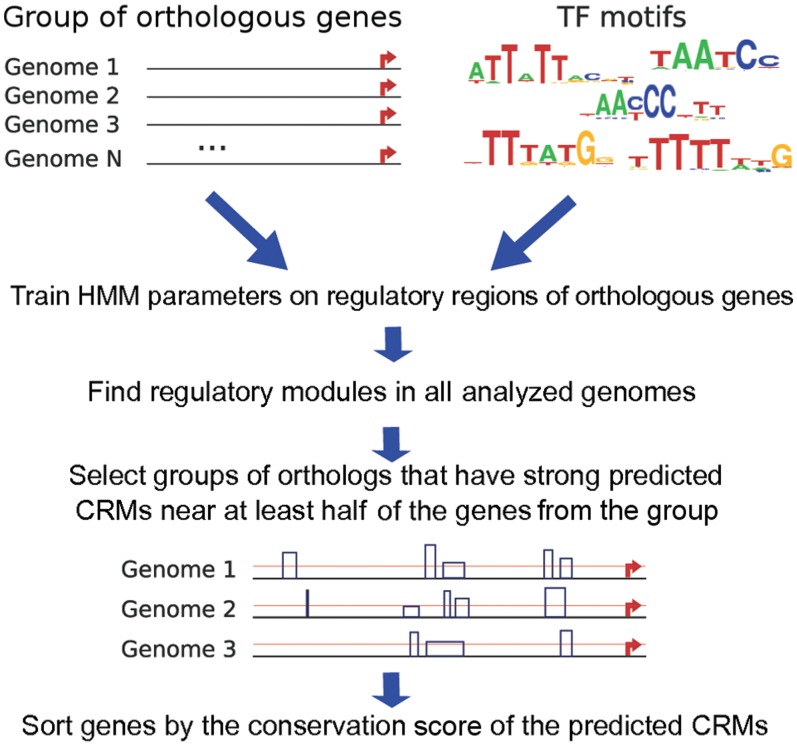
Figure 2.
The workflow of the search for co-regulated genes. Horizontal lines denote upstream regions of orthologous genes, the starts of these genes are shown by red arrows. The lowest plot reflects the program output. Blue rectangles represent predicted CRMs; the heights of the rectangles reflect the weights of the CRMs; the red line denotes the threshold for the CRMs weight (see Supplementary Materials for the output examples).

