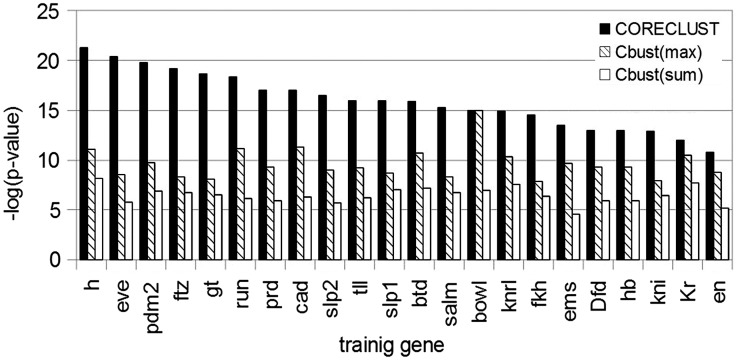
Figure 5.
Genome-wide prediction of co-regulated genes for different training genes made by CORECLUST and Cluster–Buster (Cbust). The histogram represents the comparison of the hypergeometric P-values of enrichment between the positive gene set and three different gene lists, created by CORECLUST and Cluster–Buster, sorted by the maximum [Cbust(max)] or the sum [Cbust(sum)] of the module weights.

