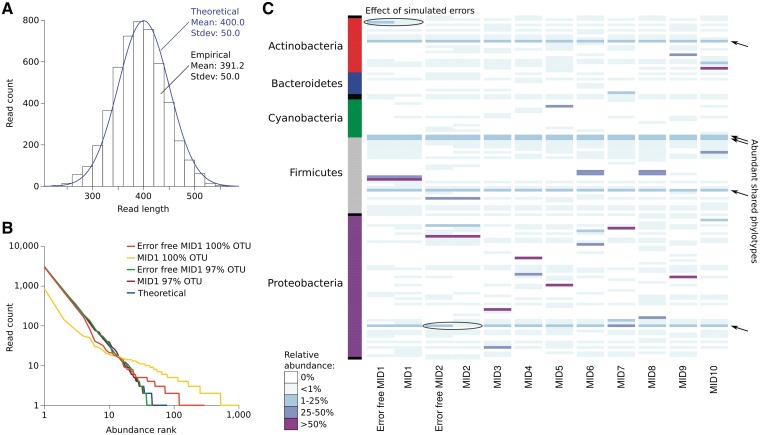
Figure 3.
Analysis of 10 MID-containing 16S rRNA gene amplicon libraries generated by Grinder that share 20% of their phylotypes. (A) Histogram of read lengths for the libraries and curve representing their expected normal distribution. (B) Log-log plot of phylotype rank-abundance in the MID1 amplicon library, with and without simulated sequencing errors, using 97% and 100% identity for OTU clustering in QIIME. (C) Heatmap comparison of the OTU distribution in the amplicon libraries analyzed with QIIME at 97% identity OTU clustering.

