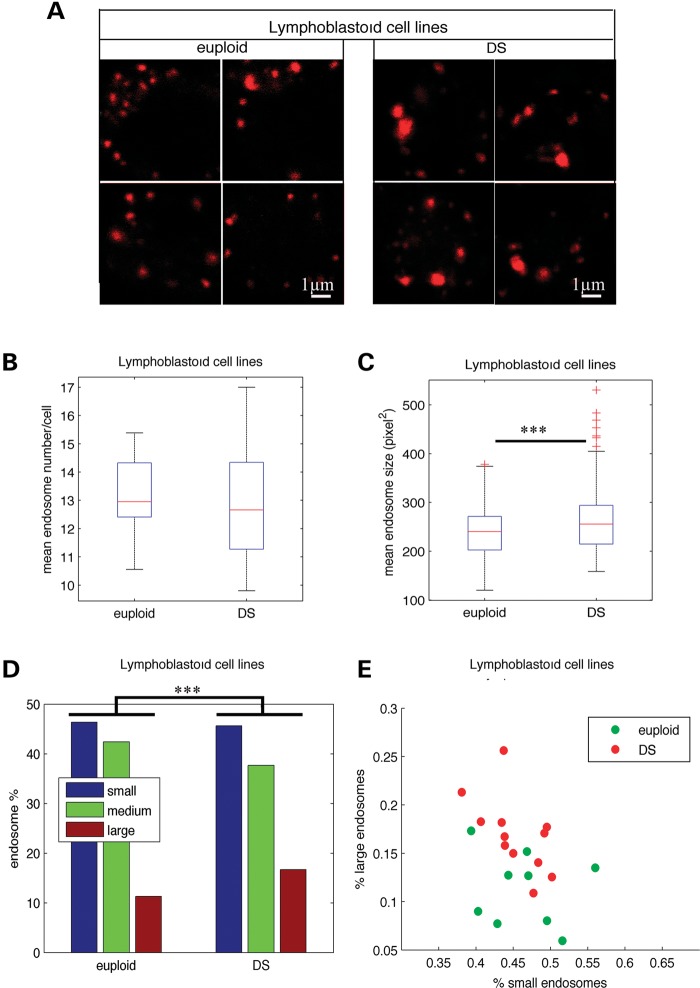
Figure 2.
Enlarged endosomes are present in LCLs from individuals with DS. (A) Representative confocal images of EEA1-positive early endosomes of LCLs from euploids and individuals with DS. (B) Mean number of EEA1-positive early endosomes in DS (n= 12) when compared with euploids (n= 9) LCLs. (C) Mean endosome size in LCLs from DS when compared with euploids. (D) Endosome size distribution of small-, medium- and large-sized endosomes, based on K-means clustering. (E) Representation of LCLs from euploid (green circles) and individuals with DS (red circles) in the plane defined by the percentage of their large and small endosomes. ***P< 0.001.

