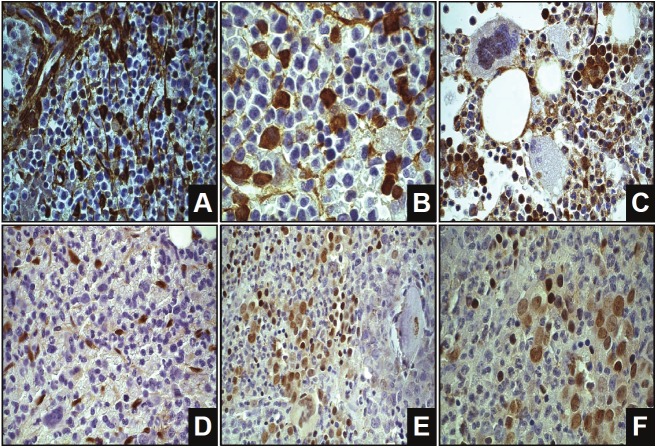
Figure 1.
Examples of galectin-1, galectin-3, pSTAT3 and pSTAT5 staining. The brown colour represents the gal-1 staining in A and B, gal-3 staining in C, pSTAT3 staining in D and pSTAT5 staining in E and F. A. Galectin-1 (630x) B. Galectin-1 (1000x) C. Galectin-3 (630x) D. pSTAT3 (630x) E. pSTAT5 (630x) F. pSTAT5 (1000x).

