Figure 1.
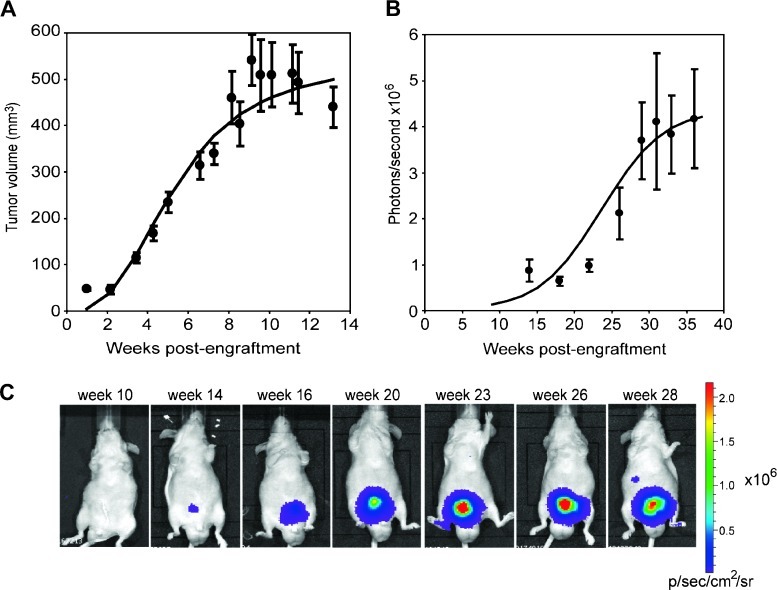
Progression of IGR-CaP1 tumors in animals. (A) Tumor progression of subcutaneously implanted IGR-CaP1 cells in nude mice (n = 20). Tumor growth was monitored weekly using caliper measurement. (B) Bioluminescent imaging time course of orthotopically inoculated GFP-and luciferase-expressing IGR-CaP1 cells. Nine mice were imaged monthly to monitor tumor growth. For A and B, the curves correspond to the adjustment of the logistic regression model on the average of the observed values at each time point, and results are expressed as the mean ± SEM. (C) A representative mouse with intraprostatic tumor monitored by BLI showing a metastatic site at week 28.

