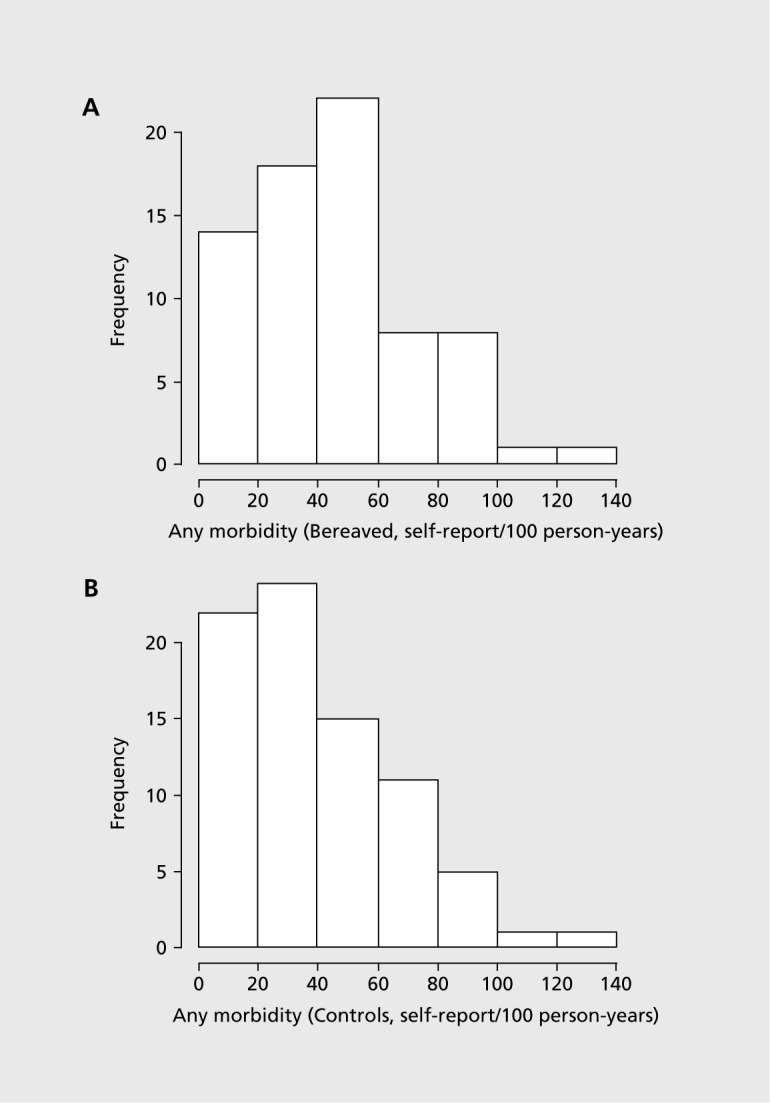
Figure 1. Distribution of total morbidity rates per 1 00 person/ years in bereaved and control cohorts in a 10-year follow-up of bereaved spouses: A bereaved cohort and B control cohort. The difference between groups in morbidity rates arose from a general elevation in the distribution of morbidity incidence among the bereaved, relative to the controls with morbidity levels due to mental health (61 % elevation, P=0.05) and circulatory system disorders (66% elevation, P=0.01) compared with controls).5 Figure reproduced from ref 5: Jones MP, Bartrop RW, Forcier L, Penny R. The long-term impact of bereavement upon spouse health: a 10-year follow-up. Acta Neuropsychiatry. 2010;22:212-217. Copyright @Wiley-Blackwell 2010.

