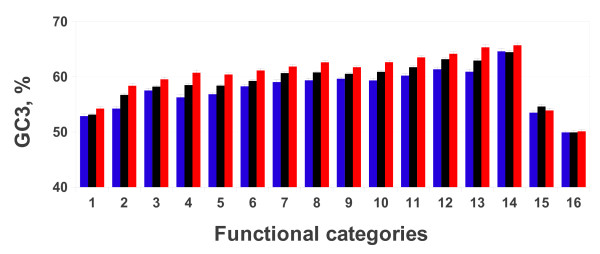
Figure 2.
The histogram shows the average GC3 content in the three functional categories in all analyzed genomes. Color code of histogram bars is as in Figure 1. For each histogram bar standard error is reported. Genome legend: M. domestica (1), S. tridecemlineatus (2), L. africana (3), D. novemcinctus (4), H. sapiens (5), P. pygmaeus (6), P. vampyrus (7), E. caballus (8), M. musculus (9), G. gorilla (10), T. truncatus (11), B. taurus (12), O. cuniculus (13), O. anatinus (14), A. carolinensis (15) and X. tropicalis (16).

