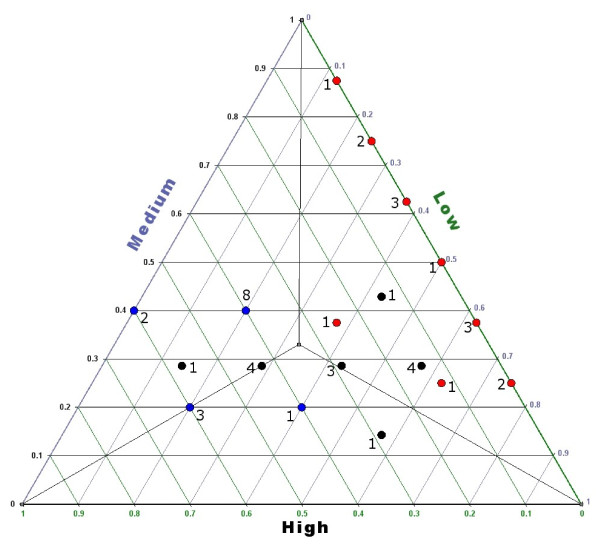
Figure 3.
de Finetti's diagram shows the spatial distribution of the three functional categories: (i) information storage and processing (Blue dots); (ii) cellular processes and signaling (Black dots); (iii) metabolism (Red dots). Numbers close to dots refer to the occurrence of overlapping genomes.

