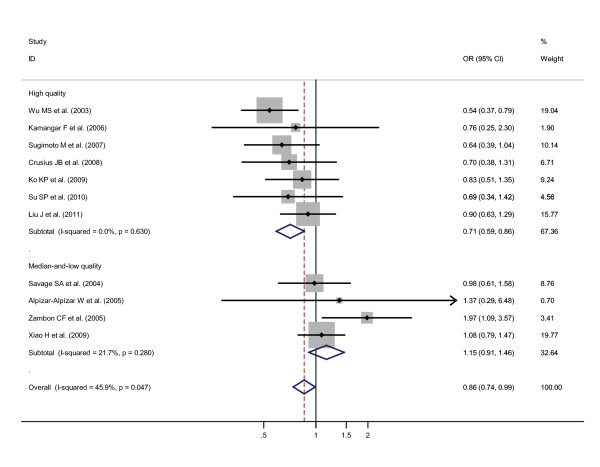
Figure 3.
Odds ratios (ORs) for associations between IL-10-819 T/C SNP and gastric cancer risk (TT vs CT-plus-CC) among high quality subgroup participants regardless of ethnicities and among median-and-low quality subgroup participants regardless of ethnicities. The sizes of the squares indicate the relative weight of each study. Bars, 95% confidence interval (CI).

