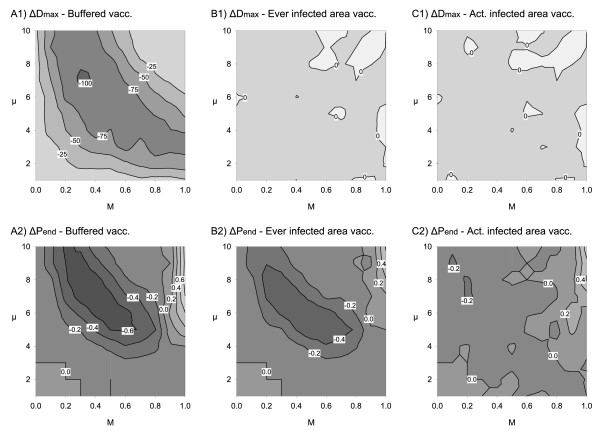
Figure 7.
Effect of strategies (A) buffered, (B) ever infected area and (C) actually infected area vaccination. Top row: changes in maximum virus spread distance Dmax, bottom row: changes in probability of virus endemicity Pend; plotted vs. case mortality M and mean infectious period of lethally infected hosts μ. Parameter combinations with negative difference reflect a positive impact of vaccination, i.e. reduced spreading distance or lowered probability of endemicity, while positive differences indicate a worse outcome of the vaccination alternative compared to the non-vaccination reference.

