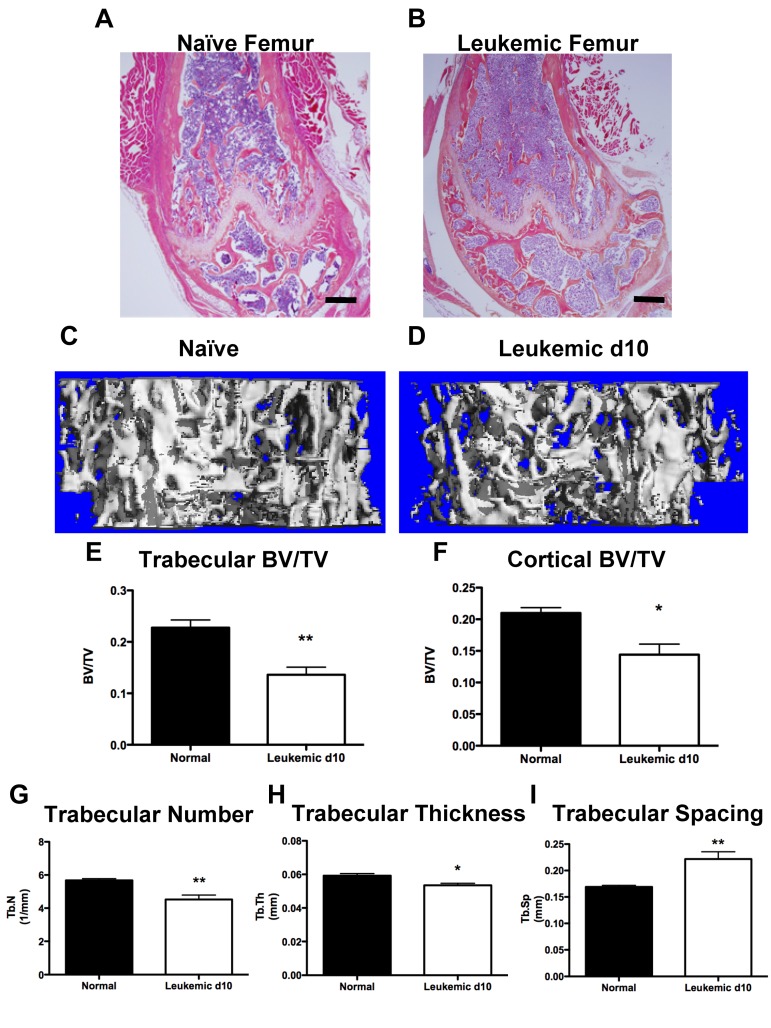
Figure 3.
Leukemic environment induces bone loss. (A-B) Representative images of H&E-stained paraffin sections of the distal femur from a (A) naive and (B) leukemic mouse 10 days after transplantation, 4× objective. (C-D) Representative micro-CT images from the metaphysis of the femur from (C) naive and (D) leukemic mice. (E) Micro-CT analysis of femur trabecular bone volume/total volume. (F) Femur cortical bone volume/total volume. (G) Trabecular number. (H) Trabecular thickness. (I) Trabecular spacing. *P ≤ .05. **P ≤ .01. n = 4 mice per experiment.

