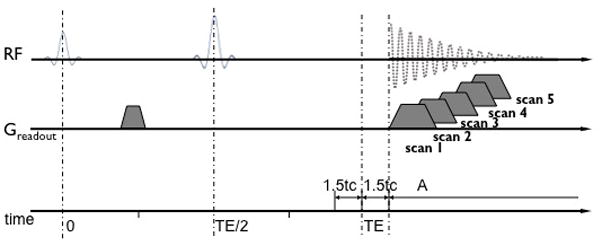
Figure 1.

Schematic diagram of the SSE ultrashort T2* relaxometry. In time interval A, the signal displays a linear exponential behavior characterized by the T2* relaxation constant. The SSE ultrashort T2* relaxometry is achieved by acquiring a series of spin echo images with the readout echo sequentially shifted to increase T2* weighting. Since there are no hardware limitations on the echo shift, it is possible to achieve steps small enough to measure T2* below 1 ms. Note: time is not to scale.
