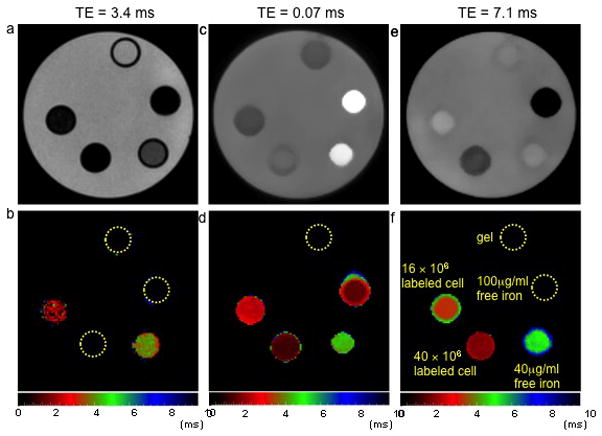
Figure 2.

Gradient echo (a), UTE (c) and spin echo (e) images of a phantom and the corresponding MGE T2* map (b), UTE T2* map (d) and SSE ultrashort T2* map (f). The five vials were filled with 16×106 (vial 1) and 40×106 SPIO labeled cells (vial 4), 40 μg (vial 2) and 100 μg free iron (vial 3), and PBS (vial 5) suspended in 1 ml agarose gel. The map derived from the MGE technique was unable to characterize the short T2* in the samples containing high concentrations of SPIOs. Both the maps derived from UTE and SSE utlrashort T2* technique were able to measure T2* in the samples with SPIO labeled cells. In the case of 100 μg free iron, both the T2 and T2* were very short, permitting mapping only with the UTE technique, highlighting SSE ultrashort T2* technique’s ability to differentiate between intracellular SPIOs and free iron. Color bars represent T2* values in ms.
