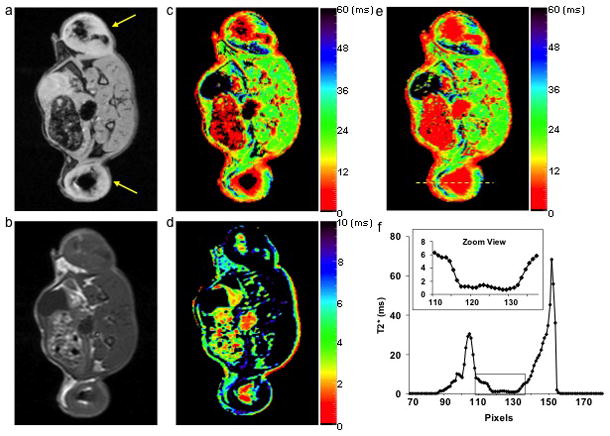
Figure 5.

a. Gradient echo image of an axial slice of a rat with SPIO labeled flank tumors (yellow arrows). b. Spin echo image of the same slice. c. Regular T2* map from the MGE sequence. d. SSE ultrashort T2* map. e. SSE ultrashort T2* map overlaid on the regular T2* map. f. Profile of the yellow line in (e). The dark regions within the tumors in (a) and (c) corresponded to highly concentrated SPIO labeled cells. The MGE T2* mapping technique failed to detect any signal from the center of the tumors (dark circle) but the SSE ultrashort T2* mapping technique adequately characterized the relaxation time. The zoomed view in (f) clearly illustrated that T2* values in the tumor center were in the range of 0 ~ 2 ms. Color bars represent T2* values in ms.
