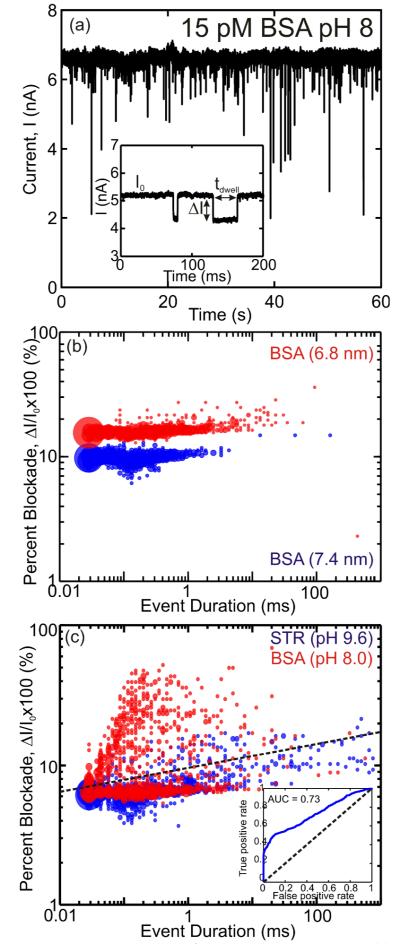
FIGURE 2. Proteins translocating through a nanopore.
(a) Pore current at 1 V bias through a 7.4 nm pore after 15 pM BSA in 100 mM KCl, 10 mM TRIS-HCl at pH 8 is introduced on the cis-side of the membrane. The frequent blockades observed in the current are indicative of the BSA interacting with the pore. The inset shows two typical events; the arrows indicate the dwell time, tdwell, the mean blockade amplitude, ΔI, and the open pore current, I0. (b) Event distribution of ΔI/I0 vs tdwell for the first 1000 recorded events of BSA at pH 8 through 6.8-nm-diameter (red) and 7.4-nm-diameter pores (blue). (c) Event distribution of ΔI/I0 vs tdwell for the first 1000 recorded events of BSA at pH 8 (red) and STR at pH 9.6 (blue) through the 7.4-nm-diameter pore. Black line shows group demarcation when the events are classified with LDA. (inset) ROC of the protein discriminator with an AUC of 0.73.

