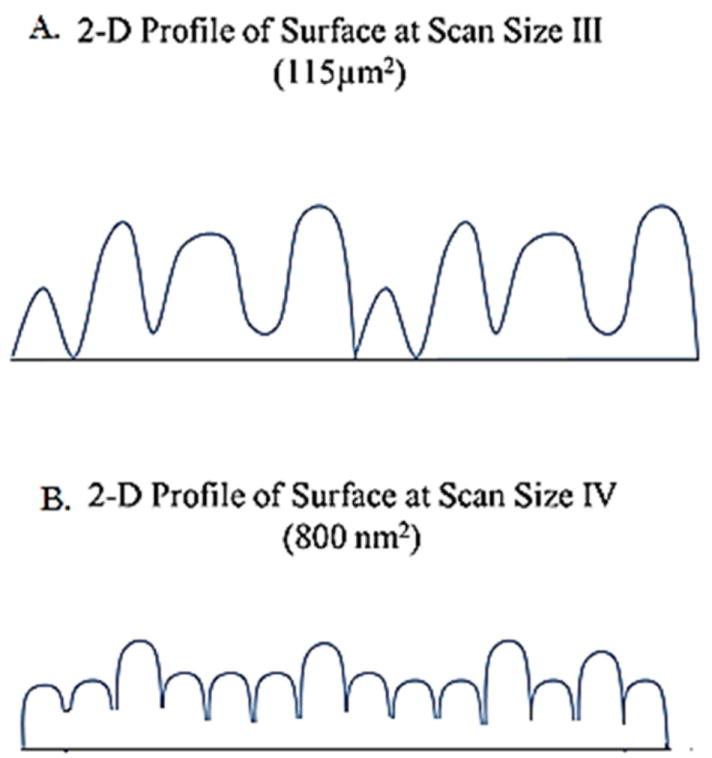
Figure 8.

Schematic 2-dimensional profiles for alloy surfaces at different scanning sizes illustrating variation in surface roughness. A) Shows greater variability in surface roughness, with a lower surface area. B) Shows reduced surface roughness variability, with an overall higher surface area due to increased frequency of variation.
