
Figure 4. Kinetic profile of SOD activity and effects of inhibitors.
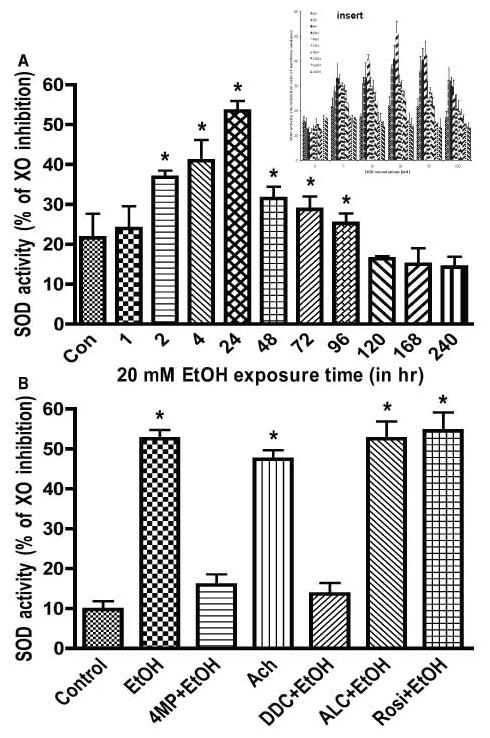
Cells cultured in 96-well plates were exposed to 20 mM EtOH that was determined from an EtOH dose-dependent study (see insert). SOD activity was expressed as the percent of xanthine oxidase (XO) activity inhibition. (A) Effects of 20 mM EtOH on the kinetic profile of SOD activity. SOD activity was determined as SOD unit/mL assay. (B) Exposure to EtOH for 24 hr (Ach for 2 hr) in the presence or absence of test compounds. Results expressed as percent of xanthine oxidase (XO) activity inhibition are presented as mean values ± SD (n = 4). *indicates statistical significance (p < 0.01) compared with controls. Concentrations of Ach (Ach, 50 μM), acetyl-L-carnitine (ALC, 50 μM) rosiglitazone (Rosi, 50 μM; PPAR-γ agonist), and diethyldithiocarbamate (DDC, 100 μM, SOD inhibitor).