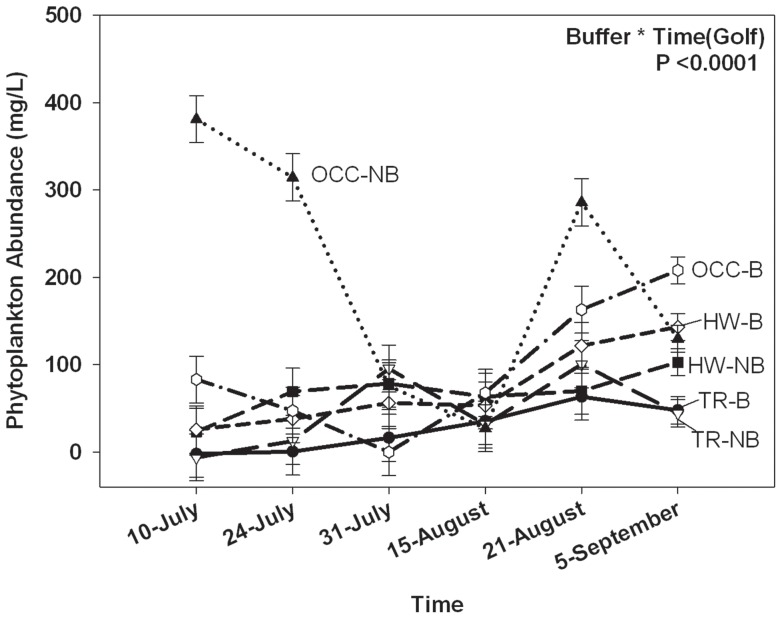
Figure 3. Changes in the abundance of phytoplankton in buffered and unbuffered golf course ponds over time.
Shown is phytoplankton abundance (µg/L) measured in buffered and unbuffered golf course ponds from July-Sept-2008. HW = Hueston Woods, TR = Twin Run, OCC = Oxford Country Club, NB = No Buffer Zone, and B = Buffer Zone. Error bars represent ± 1 SE.

