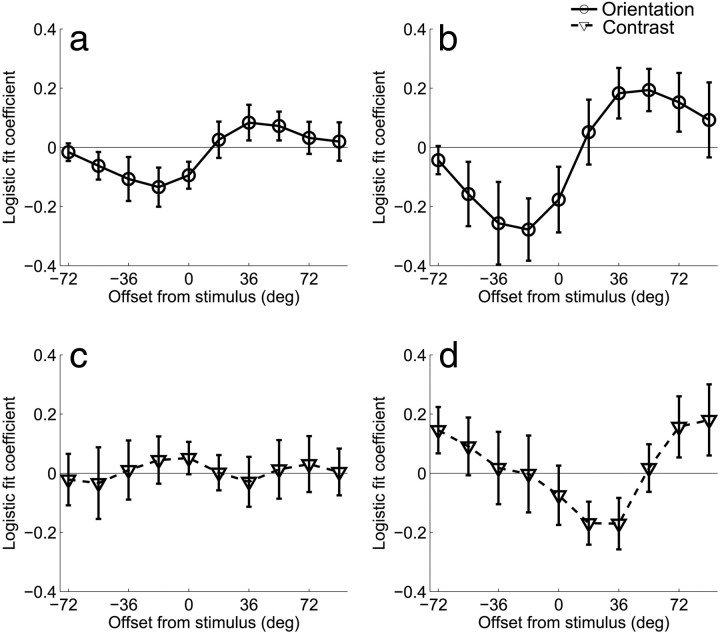
Figure 6.
Results of the logistic regression analysis for Experiment 1 that relates behavioral accuracy to the size of the differential BOLD response extracted from regions of V1 that were contralateral and ipsilateral to the deviant grating. Each channel response difference (contralateral–ipsilateral) was entered into a logistic regression as a single predictor; the logistic fit coefficients of each of the 10 analyses are plotted together (a) for the attend-orientation task across both sessions and (b) day 2 alone. Note that here, positive values refer to offsets in the direction of the deviant grating, and negative values refer to offsets in the opposite direction. On day 2, trial-by-trial fluctuations in orientation channels tuned to −18° and +54° predict subjects' accuracy on attend-orientation mismatch trials. This pattern was not observed for the attend-contrast task on (c) both sessions combined or (d) day 2 alone. Error bars indicate ±1 SEM across subjects.

